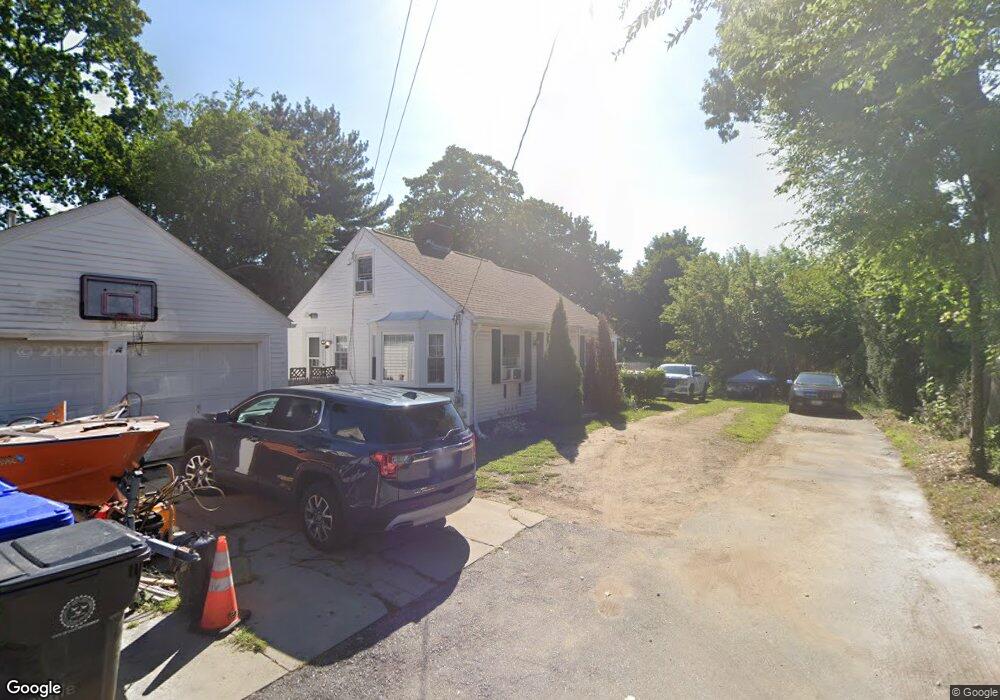
10 Roseland Ct Riverside, RI 02915
Riverside NeighborhoodEstimated Value: $397,000 - $467,000
3
Beds
1
Bath
1,050
Sq Ft
$415/Sq Ft
Est. Value
About This Home
This home is located at 10 Roseland Ct, Riverside, RI 02915 and is currently estimated at $435,417, approximately $414 per square foot. 10 Roseland Ct is a home located in Providence County with nearby schools including East Providence High School, St Luke Elementary School, and St Mary Academy-Bay View.
Ownership History
Date
Name
Owned For
Owner Type
Purchase Details
Closed on
May 14, 2024
Sold by
Aronson Jared E
Bought by
Aronson Jared E and Hernandez Samantha
Current Estimated Value
Purchase Details
Closed on
Nov 25, 1998
Sold by
Peterson Svea L and Peterson Gilbert N
Bought by
Aronson Jared E and Thomsen Sheri L
Home Financials for this Owner
Home Financials are based on the most recent Mortgage that was taken out on this home.
Original Mortgage
$105,800
Interest Rate
6.83%
Create a Home Valuation Report for This Property
The Home Valuation Report is an in-depth analysis detailing your home's value as well as a comparison with similar homes in the area
Home Values in the Area
Average Home Value in this Area
Purchase History
| Date | Buyer | Sale Price | Title Company |
|---|---|---|---|
| Aronson Jared E | -- | None Available | |
| Aronson Jared E | -- | None Available | |
| Aronson Jared E | $109,000 | -- | |
| Aronson Jared E | $109,000 | -- |
Source: Public Records
Mortgage History
| Date | Status | Borrower | Loan Amount |
|---|---|---|---|
| Previous Owner | Aronson Jared E | $105,000 | |
| Previous Owner | Aronson Jared E | $105,800 |
Source: Public Records
Tax History Compared to Growth
Tax History
| Year | Tax Paid | Tax Assessment Tax Assessment Total Assessment is a certain percentage of the fair market value that is determined by local assessors to be the total taxable value of land and additions on the property. | Land | Improvement |
|---|---|---|---|---|
| 2025 | $4,793 | $366,700 | $140,400 | $226,300 |
| 2024 | $4,570 | $298,100 | $117,000 | $181,100 |
| 2023 | $4,400 | $298,100 | $117,000 | $181,100 |
| 2022 | $3,998 | $182,900 | $66,500 | $116,400 |
| 2021 | $3,932 | $182,900 | $61,800 | $121,100 |
| 2020 | $3,766 | $182,900 | $61,800 | $121,100 |
| 2019 | $3,662 | $182,900 | $61,800 | $121,100 |
| 2018 | $4,052 | $177,100 | $60,300 | $116,800 |
| 2017 | $3,962 | $177,100 | $60,300 | $116,800 |
| 2016 | $3,942 | $177,100 | $60,300 | $116,800 |
| 2015 | $3,596 | $156,700 | $53,300 | $103,400 |
| 2014 | $3,596 | $156,700 | $53,300 | $103,400 |
Source: Public Records
Map
Nearby Homes
- 536 Willett Ave
- 25 Woodbine St
- 25 Winslow St
- 25 Read St
- 36 Woodbine St
- 735 Willett Ave Unit 806
- 57 Harris St
- 146 Becker Ave
- 74 Plum Rd
- 83 Pine Crest Dr
- 81 Pine Crest Dr
- 25 Arnold St
- 81 Sprague Ave
- 151 Willett Ave Unit 2
- 151 Willett Ave Unit 5
- 6 Hilton Ave
- 17 Oak Ave
- 33 Pine St Unit 35
- 1 Holly St
- 85 Hilton Ave