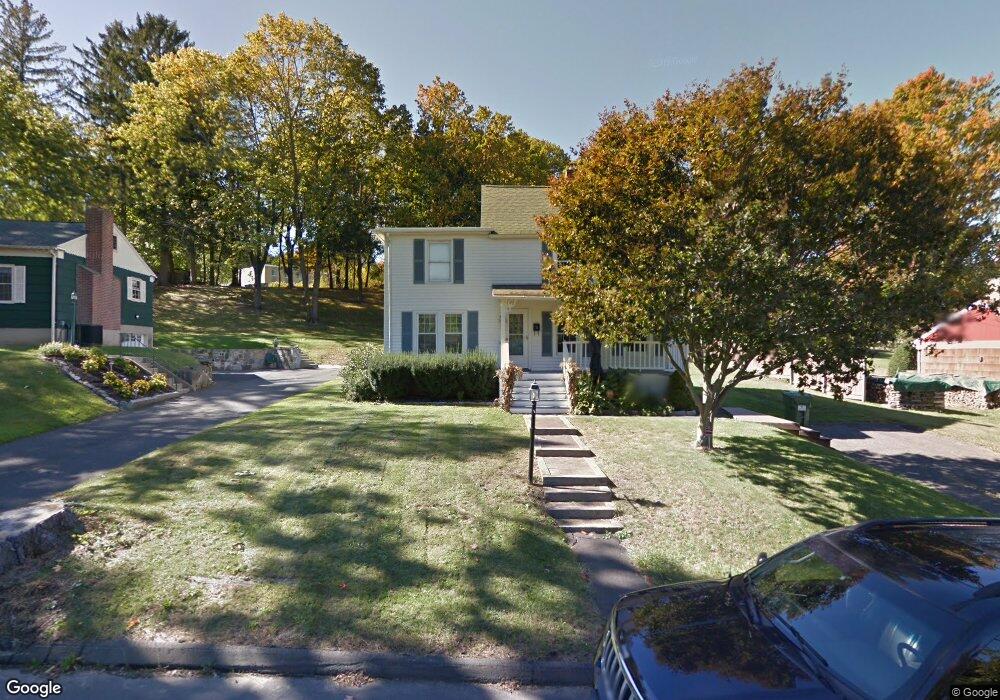
10 Ryders Ln Danbury, CT 06810
Estimated Value: $322,000 - $455,000
3
Beds
2
Baths
1,224
Sq Ft
$322/Sq Ft
Est. Value
About This Home
This home is located at 10 Ryders Ln, Danbury, CT 06810 and is currently estimated at $394,728, approximately $322 per square foot. 10 Ryders Ln is a home located in Fairfield County with nearby schools including South Street School, Rogers Park Middle School, and Danbury High School.
Ownership History
Date
Name
Owned For
Owner Type
Purchase Details
Closed on
Dec 23, 2010
Sold by
Provident Funding Asso
Bought by
Adare Invest Llc
Current Estimated Value
Home Financials for this Owner
Home Financials are based on the most recent Mortgage that was taken out on this home.
Original Mortgage
$160,000
Outstanding Balance
$105,440
Interest Rate
4.17%
Estimated Equity
$289,288
Purchase Details
Closed on
Jul 27, 2010
Sold by
Provident Funding Lp
Bought by
Fhlmc
Purchase Details
Closed on
Jul 14, 2010
Sold by
Hollister Barbara
Bought by
Provident Funding
Purchase Details
Closed on
Sep 4, 2003
Sold by
Thorne Anthony and Thorne Suzanne
Bought by
Hollister Ronald and Hollister Barbara
Purchase Details
Closed on
Nov 30, 1994
Sold by
Palardy Robert and Palardy Catherine
Bought by
Thorne Anthony and Thorne Suzanne
Create a Home Valuation Report for This Property
The Home Valuation Report is an in-depth analysis detailing your home's value as well as a comparison with similar homes in the area
Home Values in the Area
Average Home Value in this Area
Purchase History
| Date | Buyer | Sale Price | Title Company |
|---|---|---|---|
| Adare Invest Llc | $120,000 | -- | |
| Provident Funding Asso | -- | -- | |
| Fhlmc | -- | -- | |
| Provident Funding | -- | -- | |
| Hollister Ronald | $248,000 | -- | |
| Thorne Anthony | $137,000 | -- |
Source: Public Records
Mortgage History
| Date | Status | Borrower | Loan Amount |
|---|---|---|---|
| Open | Thorne Anthony | $160,000 | |
| Previous Owner | Thorne Anthony | $304,000 |
Source: Public Records
Tax History Compared to Growth
Tax History
| Year | Tax Paid | Tax Assessment Tax Assessment Total Assessment is a certain percentage of the fair market value that is determined by local assessors to be the total taxable value of land and additions on the property. | Land | Improvement |
|---|---|---|---|---|
| 2025 | $3,943 | $157,780 | $62,650 | $95,130 |
| 2024 | $3,856 | $157,780 | $62,650 | $95,130 |
| 2023 | $3,681 | $157,780 | $62,650 | $95,130 |
| 2022 | $3,979 | $141,000 | $67,600 | $73,400 |
| 2021 | $3,892 | $141,000 | $67,600 | $73,400 |
| 2020 | $3,892 | $141,000 | $67,600 | $73,400 |
| 2019 | $3,892 | $141,000 | $67,600 | $73,400 |
| 2018 | $3,892 | $141,000 | $67,600 | $73,400 |
| 2017 | $3,604 | $124,500 | $64,300 | $60,200 |
| 2016 | $3,571 | $124,500 | $64,300 | $60,200 |
| 2015 | $3,518 | $124,500 | $64,300 | $60,200 |
| 2014 | $3,436 | $124,500 | $64,300 | $60,200 |
Source: Public Records
Map
Nearby Homes
- 67 Garfield Ave
- 81 Deer Hill Ave
- 22 Main St Unit 2-13
- 22 Main St Unit 2-14
- 12 Mountainville Rd
- 163 South St Unit 72
- 79 W Wooster St
- 17 Fairview Dr Unit 3
- 136 Deer Hill Ave Unit 11
- 29 William St
- 95 Park Ave Unit 14
- 93 Park Ave Unit 1307
- 93 Park Ave Unit 1704
- 81 Park Ave Unit 605
- 51 Park Ave Unit 3-15
- 40 Park Ave
- 43 Linron Dr
- 15A Mountainville Rd
- 25 Crofut St
- 81 Coalpit Hill Rd Unit B