10 S 300 W Monroe, UT 84754
Monroe NeighborhoodEstimated Value: $438,261 - $478,000
3
Beds
2
Baths
2,362
Sq Ft
$194/Sq Ft
Est. Value
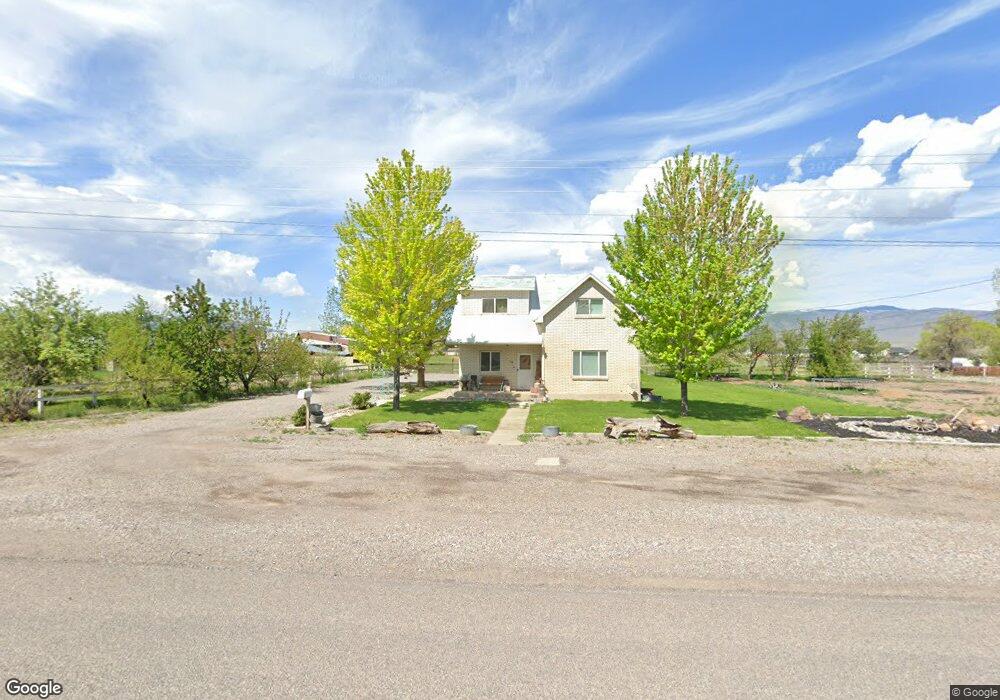
About This Home
This home is located at 10 S 300 W, Monroe, UT 84754 and is currently estimated at $458,815, approximately $194 per square foot. 10 S 300 W is a home located in Sevier County with nearby schools including Monroe School, South Sevier Middle School, and South Sevier High School.
Ownership History
Date
Name
Owned For
Owner Type
Purchase Details
Closed on
Jul 2, 2025
Sold by
Bigelow Alisha
Bought by
Ercanbrack Alisha and Ercanbrack Brian
Current Estimated Value
Purchase Details
Closed on
Sep 15, 2021
Sold by
Bigelow Alisha and Thompson Alisha P
Bought by
Bigelow Alisha
Home Financials for this Owner
Home Financials are based on the most recent Mortgage that was taken out on this home.
Original Mortgage
$215,000
Interest Rate
2.7%
Mortgage Type
New Conventional
Purchase Details
Closed on
May 23, 2014
Sold by
Allen M Diane and Allen Mary Diane
Bought by
Thompson Alisha P
Home Financials for this Owner
Home Financials are based on the most recent Mortgage that was taken out on this home.
Original Mortgage
$8,700
Interest Rate
4.23%
Mortgage Type
Stand Alone Second
Purchase Details
Closed on
Jan 3, 2011
Sold by
Adams Marion Stanley
Bought by
Allen Terry R
Home Financials for this Owner
Home Financials are based on the most recent Mortgage that was taken out on this home.
Original Mortgage
$136,000
Interest Rate
4.35%
Create a Home Valuation Report for This Property
The Home Valuation Report is an in-depth analysis detailing your home's value as well as a comparison with similar homes in the area
Home Values in the Area
Average Home Value in this Area
Purchase History
| Date | Buyer | Sale Price | Title Company |
|---|---|---|---|
| Ercanbrack Alisha | -- | Professional Title | |
| Ercanbrack Alisha | -- | Professional Title | |
| Bigelow Alisha | -- | First American Title Ins Co | |
| Thompson Alisha P | -- | Utah Title & Abstra | |
| Allen Terry R | -- | -- |
Source: Public Records
Mortgage History
| Date | Status | Borrower | Loan Amount |
|---|---|---|---|
| Previous Owner | Bigelow Alisha | $215,000 | |
| Previous Owner | Thompson Alisha P | $8,700 | |
| Previous Owner | Allen Terry R | $136,000 |
Source: Public Records
Tax History Compared to Growth
Tax History
| Year | Tax Paid | Tax Assessment Tax Assessment Total Assessment is a certain percentage of the fair market value that is determined by local assessors to be the total taxable value of land and additions on the property. | Land | Improvement |
|---|---|---|---|---|
| 2024 | $2,103 | $229,626 | $61,196 | $168,430 |
| 2023 | $2,103 | $211,909 | $58,146 | $153,763 |
| 2022 | $2,144 | $203,185 | $49,320 | $153,865 |
| 2021 | $1,775 | $139,176 | $35,260 | $103,916 |
| 2020 | $1,679 | $123,368 | $33,580 | $89,788 |
| 2019 | $1,487 | $114,760 | $30,220 | $84,540 |
| 2018 | $1,619 | $103,330 | $26,860 | $76,470 |
| 2017 | $1,530 | $101,310 | $28,880 | $72,430 |
| 2016 | $999 | $94,350 | $0 | $0 |
| 2015 | $999 | $94,350 | $0 | $0 |
| 2014 | $999 | $94,350 | $0 | $0 |
Source: Public Records
Map
Nearby Homes