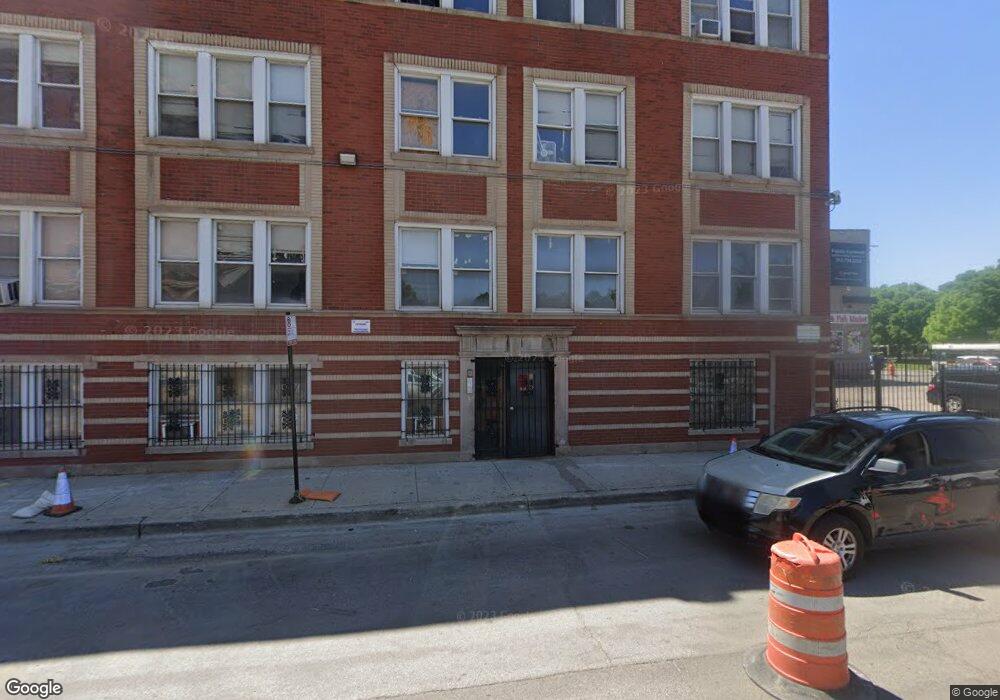
10 S Homan Ave Unit 3D Chicago, IL 60624
Garfield Park NeighborhoodEstimated Value: $166,000 - $244,000
--
Bed
--
Bath
23,208
Sq Ft
$8/Sq Ft
Est. Value
About This Home
This home is located at 10 S Homan Ave Unit 3D, Chicago, IL 60624 and is currently estimated at $196,000, approximately $8 per square foot. 10 S Homan Ave Unit 3D is a home located in Cook County with nearby schools including Faraday Elementary School, Marshall Metropolitan High School, and The Field School.
Ownership History
Date
Name
Owned For
Owner Type
Purchase Details
Closed on
Aug 8, 2022
Sold by
10-18 S Homan Ave Holdings Llc
Bought by
10 S Homan Ave Llc
Current Estimated Value
Purchase Details
Closed on
Nov 30, 2017
Sold by
Mid City Apartments Llc
Bought by
10 18 S Homan Ave Holdings Llc
Home Financials for this Owner
Home Financials are based on the most recent Mortgage that was taken out on this home.
Original Mortgage
$903,000
Interest Rate
3.94%
Mortgage Type
Commercial
Purchase Details
Closed on
Jan 31, 2014
Sold by
Homan Apartment Rentals Inc
Bought by
Mid City Apartments Llc
Purchase Details
Closed on
Feb 8, 2008
Sold by
Chicago Title Land Trust Co
Bought by
Homan Apartments Rentals Inc
Home Financials for this Owner
Home Financials are based on the most recent Mortgage that was taken out on this home.
Original Mortgage
$800,000
Interest Rate
5.75%
Mortgage Type
Purchase Money Mortgage
Create a Home Valuation Report for This Property
The Home Valuation Report is an in-depth analysis detailing your home's value as well as a comparison with similar homes in the area
Home Values in the Area
Average Home Value in this Area
Purchase History
| Date | Buyer | Sale Price | Title Company |
|---|---|---|---|
| 10 S Homan Ave Llc | $1,000,000 | None Listed On Document | |
| 10 18 S Homan Ave Holdings Llc | $466,500 | Madison Title Agency Llc | |
| Mid City Apartments Llc | -- | Chicago Title Insurance Co | |
| Homan Apartments Rentals Inc | -- | Chicago Title Land Trust Co |
Source: Public Records
Mortgage History
| Date | Status | Borrower | Loan Amount |
|---|---|---|---|
| Previous Owner | 10 18 S Homan Ave Holdings Llc | $903,000 | |
| Previous Owner | Homan Apartments Rentals Inc | $800,000 |
Source: Public Records
Tax History Compared to Growth
Tax History
| Year | Tax Paid | Tax Assessment Tax Assessment Total Assessment is a certain percentage of the fair market value that is determined by local assessors to be the total taxable value of land and additions on the property. | Land | Improvement |
|---|---|---|---|---|
| 2024 | $1,322 | $11,959 | $1,177 | $10,782 |
| 2023 | $1,289 | $6,268 | $1,015 | $5,253 |
| 2022 | $1,289 | $6,268 | $1,015 | $5,253 |
| 2021 | $1,260 | $6,267 | $1,014 | $5,253 |
| 2020 | $1,422 | $6,382 | $1,014 | $5,368 |
| 2019 | $1,282 | $6,382 | $1,014 | $5,368 |
| 2018 | $1,261 | $6,382 | $1,014 | $5,368 |
| 2017 | $1,348 | $6,264 | $669 | $5,595 |
| 2016 | $1,463 | $7,303 | $852 | $6,451 |
| 2015 | $1,338 | $7,303 | $852 | $6,451 |
| 2014 | $1,334 | $7,190 | $852 | $6,338 |
| 2013 | $1,308 | $7,190 | $852 | $6,338 |
Source: Public Records
Map
Nearby Homes
- 3328 W Warren Blvd
- 3334 W Warren Blvd
- 3235 W Warren Blvd Unit 2
- 3316 W Maypole Ave
- 3508 W Jackson Blvd
- 3159 W Madison St
- 3153 W Madison St
- 328 S Spaulding Ave
- 3351 W Walnut St
- 3502 W Lake St
- 3455 W Walnut St
- 3200 W Lake St
- 3530 W Van Buren St
- 3408 W Congress Pkwy Unit 3
- 209 S Albany Ave
- 3534 W Fulton Blvd
- 3031 W 5th Ave
- 127 S Whipple St
- 4408 W Monroe St
- 4008 W Monroe St
- 10 S Homan Ave Unit 3C
- 10 S Homan Ave Unit 3B
- 10 S Homan Ave Unit 3A
- 10 S Homan Ave Unit 2E
- 10 S Homan Ave Unit 2D
- 10 S Homan Ave Unit 2C
- 10 S Homan Ave Unit 2B
- 10 S Homan Ave Unit 2A
- 10 S Homan Ave Unit 1E
- 10 S Homan Ave Unit 1D
- 10 S Homan Ave Unit 1C
- 10 S Homan Ave Unit 1B
- 10 S Homan Ave Unit 1A
- 10 S Homan Ave Unit 3E
- 10 S Homan Ave
- 3407 1/2 W Madison St
- 3407 1/2 W Madison St
- 3407 W Madison St
- 3411 W Madison St
- 3415 W Madison St