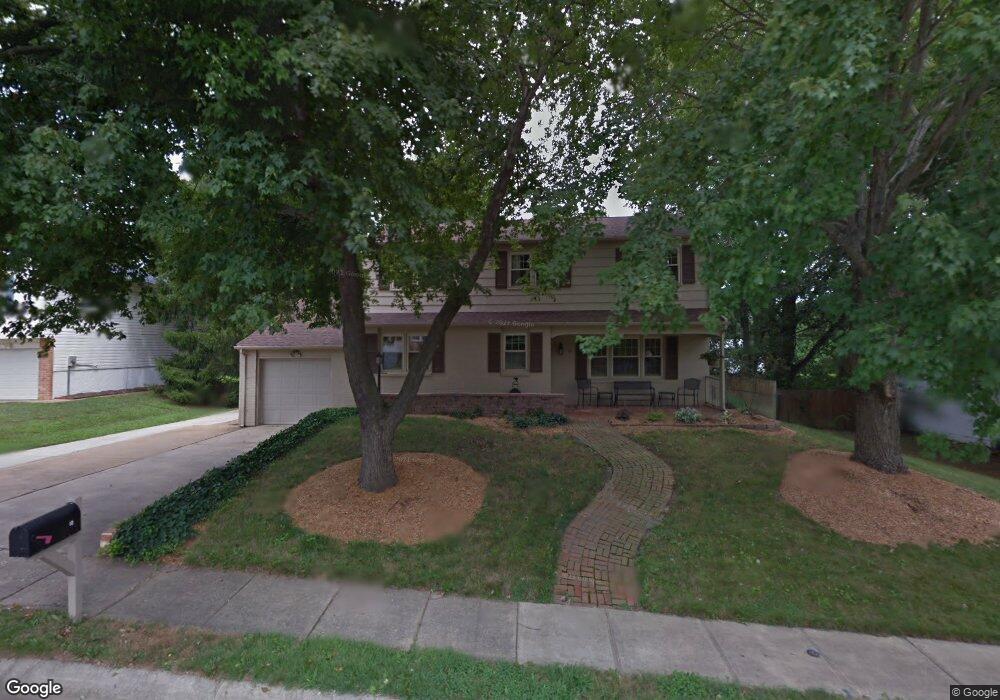
10 S Wynwyd Dr Newark, DE 19711
Estimated Value: $471,000 - $508,000
4
Beds
3
Baths
2,289
Sq Ft
$214/Sq Ft
Est. Value
About This Home
This home is located at 10 S Wynwyd Dr, Newark, DE 19711 and is currently estimated at $489,543, approximately $213 per square foot. 10 S Wynwyd Dr is a home located in New Castle County with nearby schools including Downes (John R.) Elementary School, Shue-Medill Middle School, and Newark High School.
Ownership History
Date
Name
Owned For
Owner Type
Purchase Details
Closed on
Oct 7, 2011
Sold by
Tacconelli Joseph A and Tacconelli Kathleen N
Bought by
Cavall James R
Current Estimated Value
Home Financials for this Owner
Home Financials are based on the most recent Mortgage that was taken out on this home.
Original Mortgage
$217,600
Outstanding Balance
$20,698
Interest Rate
4.2%
Mortgage Type
New Conventional
Estimated Equity
$468,845
Create a Home Valuation Report for This Property
The Home Valuation Report is an in-depth analysis detailing your home's value as well as a comparison with similar homes in the area
Home Values in the Area
Average Home Value in this Area
Purchase History
| Date | Buyer | Sale Price | Title Company |
|---|---|---|---|
| Cavall James R | $272,000 | None Available |
Source: Public Records
Mortgage History
| Date | Status | Borrower | Loan Amount |
|---|---|---|---|
| Open | Cavall James R | $217,600 |
Source: Public Records
Tax History Compared to Growth
Tax History
| Year | Tax Paid | Tax Assessment Tax Assessment Total Assessment is a certain percentage of the fair market value that is determined by local assessors to be the total taxable value of land and additions on the property. | Land | Improvement |
|---|---|---|---|---|
| 2024 | $927 | $87,900 | $13,700 | $74,200 |
| 2023 | $3,179 | $87,900 | $13,700 | $74,200 |
| 2022 | $3,145 | $87,900 | $13,700 | $74,200 |
| 2021 | $3,064 | $87,900 | $13,700 | $74,200 |
| 2020 | $2,976 | $87,900 | $13,700 | $74,200 |
| 2019 | $2,609 | $87,900 | $13,700 | $74,200 |
| 2018 | $2,412 | $87,900 | $13,700 | $74,200 |
| 2017 | $2,341 | $83,200 | $13,700 | $69,500 |
| 2016 | $2,334 | $83,200 | $13,700 | $69,500 |
| 2015 | $2,092 | $83,200 | $13,700 | $69,500 |
| 2014 | $2,091 | $83,200 | $13,700 | $69,500 |
Source: Public Records
Map
Nearby Homes