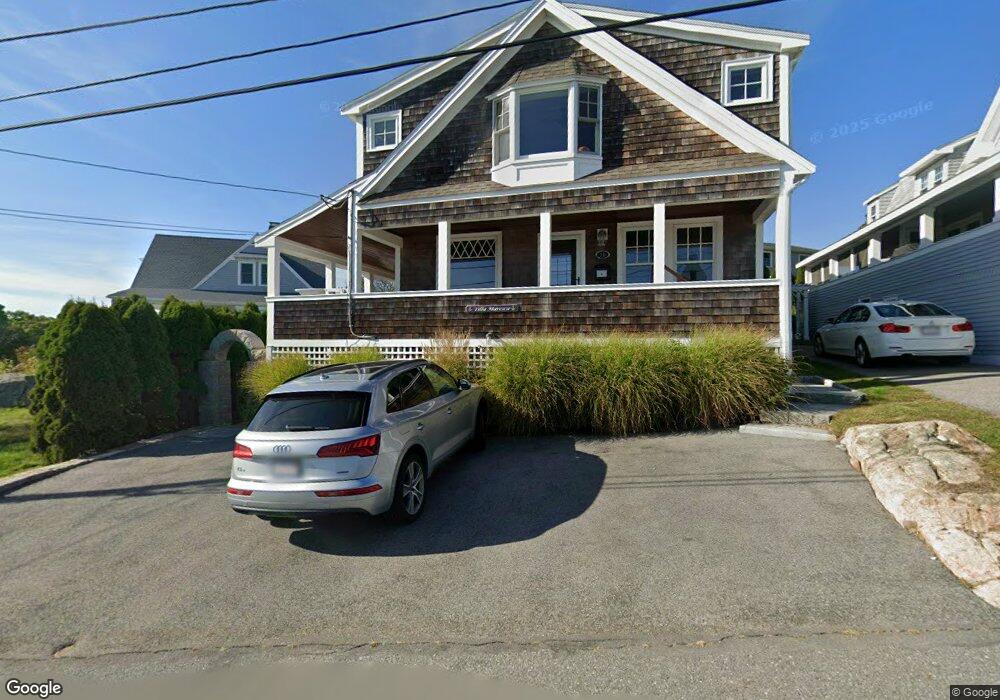
10 Salt Island Rd Gloucester, MA 01930
East Gloucester NeighborhoodEstimated Value: $1,528,928 - $1,763,000
5
Beds
3
Baths
2,304
Sq Ft
$711/Sq Ft
Est. Value
About This Home
This home is located at 10 Salt Island Rd, Gloucester, MA 01930 and is currently estimated at $1,638,232, approximately $711 per square foot. 10 Salt Island Rd is a home located in Essex County with nearby schools including East Gloucester Elementary School, Ralph B O'maley Middle School, and Gloucester High School.
Ownership History
Date
Name
Owned For
Owner Type
Purchase Details
Closed on
Jun 25, 2010
Sold by
Johansen William and Johansen Nancy Souza
Bought by
Meier Steven and Meier Theresa
Current Estimated Value
Home Financials for this Owner
Home Financials are based on the most recent Mortgage that was taken out on this home.
Original Mortgage
$623,200
Outstanding Balance
$408,153
Interest Rate
4.98%
Mortgage Type
Purchase Money Mortgage
Estimated Equity
$1,230,079
Create a Home Valuation Report for This Property
The Home Valuation Report is an in-depth analysis detailing your home's value as well as a comparison with similar homes in the area
Home Values in the Area
Average Home Value in this Area
Purchase History
We collect this data history from publicly available records. To have your information removed, we recommend requesting removal directly through your county’s website.
| Date | Buyer | Sale Price | Title Company |
|---|---|---|---|
| Meier Steven | $779,000 | -- | |
| Meier Steven | $779,000 | -- |
Source: Public Records
Mortgage History
We collect this data history from publicly available records. To have your information removed, we recommend requesting removal directly through your county’s website.
| Date | Status | Borrower | Loan Amount |
|---|---|---|---|
| Open | Meier Steven | $623,200 | |
| Closed | Meier Steven | $623,200 |
Source: Public Records
Tax History
| Year | Tax Paid | Tax Assessment Tax Assessment Total Assessment is a certain percentage of the fair market value that is determined by local assessors to be the total taxable value of land and additions on the property. | Land | Improvement |
|---|---|---|---|---|
| 2025 | $12,640 | $1,300,400 | $712,900 | $587,500 |
| 2024 | $12,322 | $1,266,400 | $678,900 | $587,500 |
| 2023 | $11,860 | $1,119,900 | $606,200 | $513,700 |
| 2022 | $11,465 | $977,400 | $527,100 | $450,300 |
| 2021 | $11,064 | $889,400 | $479,200 | $410,200 |
| 2020 | $10,677 | $865,900 | $451,800 | $414,100 |
| 2019 | $10,501 | $827,500 | $451,800 | $375,700 |
| 2018 | $10,339 | $799,600 | $451,800 | $347,800 |
| 2017 | $9,659 | $732,300 | $430,400 | $301,900 |
| 2016 | $9,281 | $681,900 | $408,200 | $273,700 |
| 2015 | $8,144 | $596,600 | $343,700 | $252,900 |
Source: Public Records
Map
Nearby Homes
- 25 Salt Island Rd
- 18r Starknaught Heights Unit A
- 32 Witham St Unit B
- 19 Atlantic Rd Unit 25
- 4 Graystone Rd
- 6R Neptune Place Unit 1
- 5 Mount Pleasant Ave
- 8 Blake Ct
- 33 Highview Rd
- 163 Atlantic Rd Unit 6
- 197 E Main St Unit 1
- 176 Main St Unit B
- 176 Main St Unit A
- 23 Mount Vernon St
- 141 Prospect St
- 141 Prospect St Unit B
- 141 Prospect St Unit A
- 14R Spring St Unit 3
- 7 Dodge St Unit 2
- 274 Main St Unit 4
- 8 Salt Island Rd
- 12 Salt Island Rd
- 11 Barberry Way
- 14 Salt Island Rd
- 4 Brier Neck Rd
- 3 Barberry Way
- 7 Salt Island Rd
- 13 Salt Island Rd
- 11 Barberry Way
- 6 Brier Neck Rd
- 6 Salt Island Rd
- 5 Barberry Way
- 13 Barberry Way
- 15 Barberry Way
- 15 Salt Island Rd
- 11 Salt Island Rd
- 9 Salt Island Rd
- 5 Salt Island Rd
- 4 Barberry Way
- 1 Brier Neck Rd
Your Personal Tour Guide
Ask me questions while you tour the home.