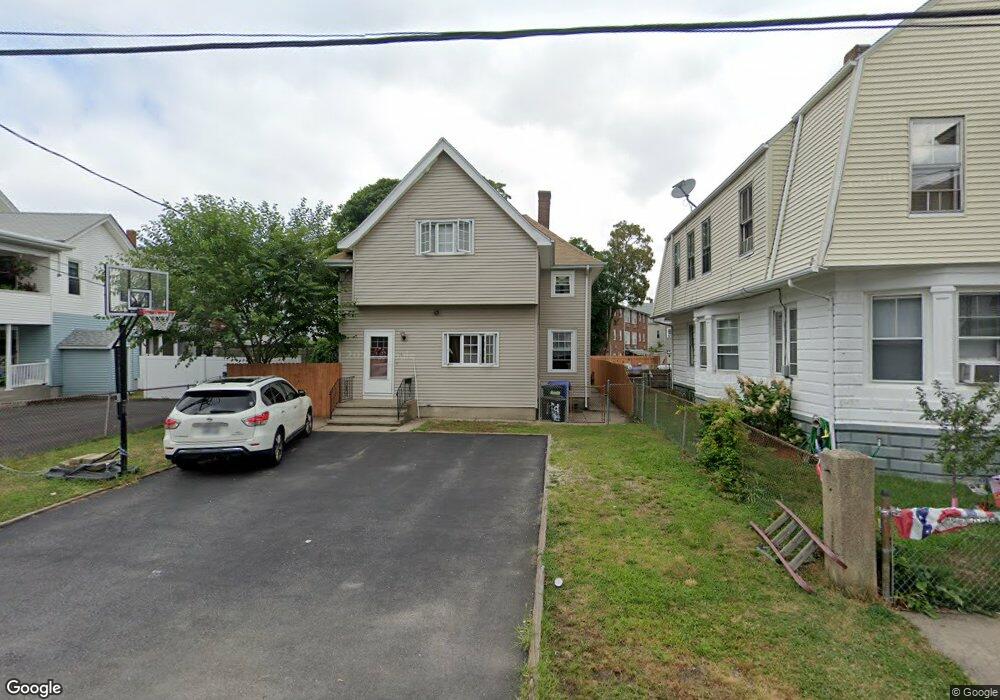
10 Sanford St Unit 2 Pawtucket, RI 02860
Pleasant View NeighborhoodEstimated Value: $470,503 - $539,000
2
Beds
1
Bath
930
Sq Ft
$550/Sq Ft
Est. Value
About This Home
This home is located at 10 Sanford St Unit 2, Pawtucket, RI 02860 and is currently estimated at $511,376, approximately $549 per square foot. 10 Sanford St Unit 2 is a home located in Providence County with nearby schools including St Cecilia School and Saint Raphael Academy.
Ownership History
Date
Name
Owned For
Owner Type
Purchase Details
Closed on
Aug 5, 2021
Sold by
Macedo Kristen
Bought by
Manug Oakgar
Current Estimated Value
Purchase Details
Closed on
Jun 7, 2016
Sold by
Mutual Props Solutions
Bought by
Macedo Kristen
Home Financials for this Owner
Home Financials are based on the most recent Mortgage that was taken out on this home.
Original Mortgage
$206,196
Interest Rate
3.5%
Mortgage Type
FHA
Purchase Details
Closed on
Jan 13, 2016
Sold by
Vanthuyne Victor E
Bought by
Mutual Properties Sol
Home Financials for this Owner
Home Financials are based on the most recent Mortgage that was taken out on this home.
Original Mortgage
$121,067
Interest Rate
3.97%
Purchase Details
Closed on
Apr 20, 2011
Sold by
Vanthuyne Victor E and Vanthuyne Victor E
Bought by
Vanthuyne Victor E and Vanthuyne Victor E
Create a Home Valuation Report for This Property
The Home Valuation Report is an in-depth analysis detailing your home's value as well as a comparison with similar homes in the area
Home Values in the Area
Average Home Value in this Area
Purchase History
| Date | Buyer | Sale Price | Title Company |
|---|---|---|---|
| Manug Oakgar | $355,000 | None Available | |
| Macedo Kristen | $210,000 | -- | |
| Mutual Properties Sol | $86,750 | -- | |
| Vanthuyne Victor E | -- | -- | |
| Vanthuyne Victor E | -- | -- |
Source: Public Records
Mortgage History
| Date | Status | Borrower | Loan Amount |
|---|---|---|---|
| Previous Owner | Macedo Kristen | $206,196 | |
| Previous Owner | Mutual Properties Sol | $121,067 |
Source: Public Records
Tax History Compared to Growth
Tax History
| Year | Tax Paid | Tax Assessment Tax Assessment Total Assessment is a certain percentage of the fair market value that is determined by local assessors to be the total taxable value of land and additions on the property. | Land | Improvement |
|---|---|---|---|---|
| 2025 | $5,267 | $400,500 | $107,300 | $293,200 |
| 2024 | $4,942 | $400,500 | $107,300 | $293,200 |
| 2023 | $4,565 | $269,500 | $62,200 | $207,300 |
| 2022 | $4,468 | $269,500 | $62,200 | $207,300 |
| 2021 | $4,468 | $269,500 | $62,200 | $207,300 |
| 2020 | $3,950 | $189,100 | $51,800 | $137,300 |
| 2019 | $3,934 | $188,300 | $51,800 | $136,500 |
| 2018 | $3,790 | $188,300 | $51,800 | $136,500 |
| 2017 | $3,074 | $135,300 | $42,500 | $92,800 |
| 2016 | $2,942 | $134,400 | $42,500 | $91,900 |
| 2015 | $2,942 | $134,400 | $42,500 | $91,900 |
| 2014 | $2,915 | $126,400 | $42,500 | $83,900 |
Source: Public Records
Map
Nearby Homes
- 71 Lyon St
- 19 Wood St
- 176 Central Ave
- 168 Central Ave
- 36 Underwood St
- 54 Sabin St
- 10 Exchange Ct Unit 203
- 10 Exchange Ct Unit 506
- 211 Carnation St
- 146 S Bend St
- 300 Front St Unit 105
- 50 Carnation St Unit 2
- 396 Roosevelt Ave
- 166 Division St
- 41 Arch St
- 784 York Ave
- 5 Robert St
- 70 Brewster St
- 92 India St
- 511 High St