10 Scotland Rd Cranston, RI 02920
Comstock Gardens NeighborhoodEstimated Value: $422,176 - $439,000
3
Beds
1
Bath
1,251
Sq Ft
$342/Sq Ft
Est. Value
About This Home
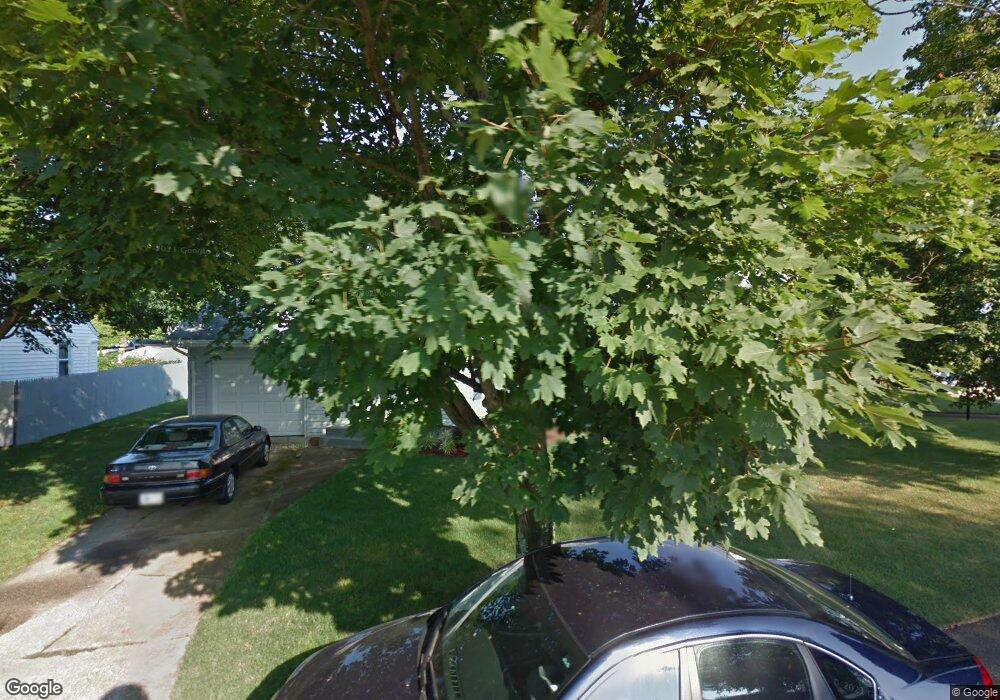
This home is located at 10 Scotland Rd, Cranston, RI 02920 and is currently estimated at $427,294, approximately $341 per square foot. 10 Scotland Rd is a home located in Providence County with nearby schools including George J. Peters School, Western Hills Middle School, and Cranston High School West.
Ownership History
Date
Name
Owned For
Owner Type
Purchase Details
Closed on
Feb 21, 2018
Sold by
Ryan Robert W
Bought by
Robert W Ryan 2018 Ret
Current Estimated Value
Purchase Details
Closed on
Oct 7, 1993
Sold by
Dertoumaian Elvira
Bought by
Ryan Robert W and Ryan Diane
Create a Home Valuation Report for This Property
The Home Valuation Report is an in-depth analysis detailing your home's value as well as a comparison with similar homes in the area
Home Values in the Area
Average Home Value in this Area
Purchase History
| Date | Buyer | Sale Price | Title Company |
|---|---|---|---|
| Robert W Ryan 2018 Ret | -- | -- | |
| Ryan Robert W | $90,000 | -- |
Source: Public Records
Mortgage History
| Date | Status | Borrower | Loan Amount |
|---|---|---|---|
| Open | Ryan Robert W | $42,000 | |
| Previous Owner | Ryan Robert W | $145,000 | |
| Previous Owner | Ryan Robert W | $147,000 |
Source: Public Records
Tax History Compared to Growth
Tax History
| Year | Tax Paid | Tax Assessment Tax Assessment Total Assessment is a certain percentage of the fair market value that is determined by local assessors to be the total taxable value of land and additions on the property. | Land | Improvement |
|---|---|---|---|---|
| 2025 | $4,872 | $351,000 | $144,400 | $206,600 |
| 2024 | $4,777 | $351,000 | $144,400 | $206,600 |
| 2023 | $4,804 | $254,200 | $103,300 | $150,900 |
| 2022 | $4,705 | $254,200 | $103,300 | $150,900 |
| 2021 | $4,576 | $254,200 | $103,300 | $150,900 |
| 2020 | $4,661 | $224,400 | $103,300 | $121,100 |
| 2019 | $4,661 | $224,400 | $103,300 | $121,100 |
| 2018 | $4,553 | $224,400 | $103,300 | $121,100 |
| 2017 | $4,411 | $192,300 | $88,500 | $103,800 |
| 2016 | $4,317 | $192,300 | $88,500 | $103,800 |
| 2015 | $4,317 | $192,300 | $88,500 | $103,800 |
| 2014 | $4,143 | $181,400 | $84,900 | $96,500 |
Source: Public Records
Map
Nearby Homes