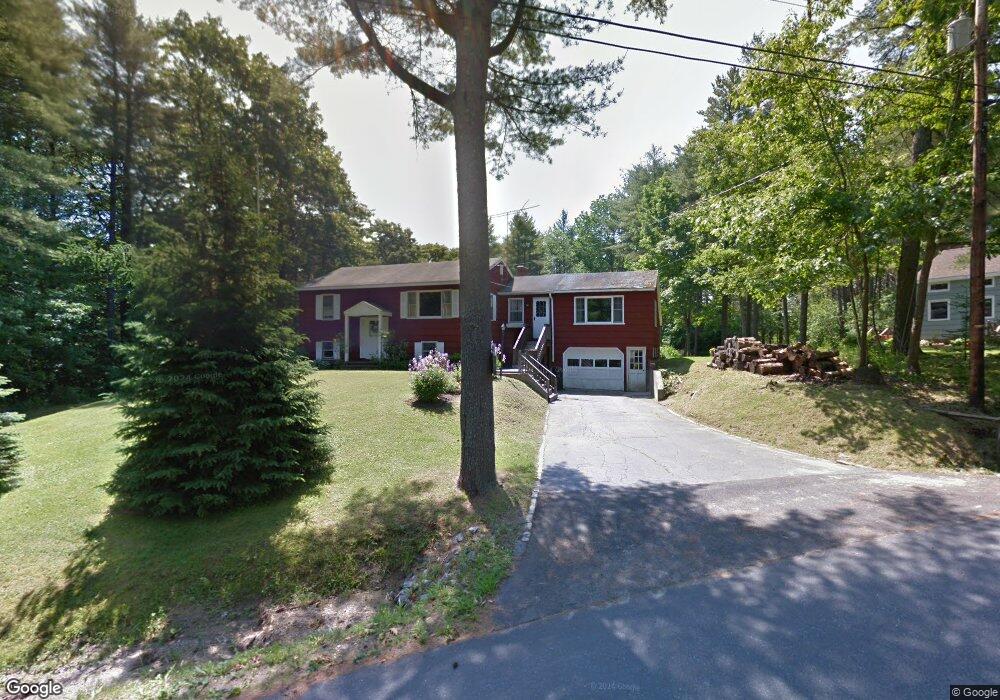
10 Sequoia Dr Freeport, ME 04032
Estimated Value: $421,000 - $520,000
3
Beds
2
Baths
1,451
Sq Ft
$316/Sq Ft
Est. Value
About This Home
This home is located at 10 Sequoia Dr, Freeport, ME 04032 and is currently estimated at $458,579, approximately $316 per square foot. 10 Sequoia Dr is a home located in Cumberland County with nearby schools including Morse Street School, Mast Landing School, and Freeport Middle School.
Ownership History
Date
Name
Owned For
Owner Type
Purchase Details
Closed on
Feb 7, 2008
Sold by
Crowley Gordon H and Crowley Anna R
Bought by
Crowley David S and Crowley Cheryl E
Current Estimated Value
Home Financials for this Owner
Home Financials are based on the most recent Mortgage that was taken out on this home.
Original Mortgage
$250,000
Outstanding Balance
$155,255
Interest Rate
6.2%
Mortgage Type
Purchase Money Mortgage
Estimated Equity
$303,324
Create a Home Valuation Report for This Property
The Home Valuation Report is an in-depth analysis detailing your home's value as well as a comparison with similar homes in the area
Home Values in the Area
Average Home Value in this Area
Purchase History
| Date | Buyer | Sale Price | Title Company |
|---|---|---|---|
| Crowley David S | -- | -- | |
| Crowley David S | -- | -- |
Source: Public Records
Mortgage History
| Date | Status | Borrower | Loan Amount |
|---|---|---|---|
| Open | Crowley David S | $250,000 | |
| Closed | Crowley David S | $250,000 |
Source: Public Records
Tax History
| Year | Tax Paid | Tax Assessment Tax Assessment Total Assessment is a certain percentage of the fair market value that is determined by local assessors to be the total taxable value of land and additions on the property. | Land | Improvement |
|---|---|---|---|---|
| 2025 | $4,537 | $327,600 | $126,000 | $201,600 |
| 2024 | $4,293 | $321,600 | $120,000 | $201,600 |
| 2023 | $3,927 | $285,600 | $109,100 | $176,500 |
| 2022 | $3,739 | $273,900 | $97,400 | $176,500 |
| 2021 | $3,658 | $274,000 | $97,400 | $176,600 |
| 2020 | $3,541 | $252,900 | $90,200 | $162,700 |
| 2019 | $3,439 | $240,500 | $85,100 | $155,400 |
| 2018 | $3,325 | $220,900 | $77,100 | $143,800 |
| 2017 | $3,183 | $212,900 | $75,400 | $137,500 |
| 2016 | $3,144 | $199,000 | $71,500 | $127,500 |
| 2015 | $3,291 | $195,900 | $79,900 | $116,000 |
| 2014 | $3,095 | $195,900 | $79,900 | $116,000 |
| 2013 | $3,096 | $195,300 | $80,000 | $115,300 |
Source: Public Records
Map
Nearby Homes
- 17 Youngs Ln Unit 17
- 27 Youngs Ln Unit 27
- 2 Tidal Brook Rd
- 62 Webster Rd
- 177 Bluff Rd Unit 20
- 9 Gables Dr Unit 9
- 823 North Rd
- 0 Bayview St
- 51 Old Field Rd
- 166 E Main St
- 20 Harvest Ridge Rd Unit 23
- 34 Sisquisic Trail
- 26 Harvest Ridge Rd Unit 24
- 20 Island Park
- 39 Hunter Rd
- 353 Mountfort Rd
- 15 Linwood Rd Unit 15
- 52 Blueberry Cove Rd Unit 52
- 1 Railroad Square Unit 305
- 18 Portland St
Your Personal Tour Guide
Ask me questions while you tour the home.