10 Shamrock Ave Seneca Falls, NY 13148
Estimated Value: $131,544 - $163,000
2
Beds
1
Bath
1,195
Sq Ft
$123/Sq Ft
Est. Value
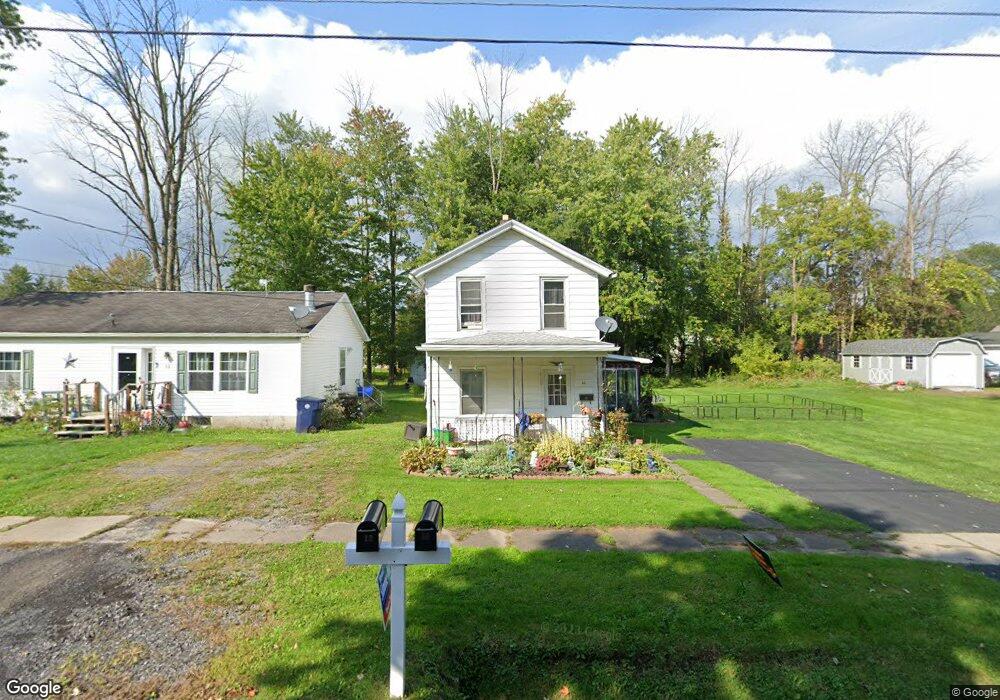
About This Home
This home is located at 10 Shamrock Ave, Seneca Falls, NY 13148 and is currently estimated at $147,136, approximately $123 per square foot. 10 Shamrock Ave is a home located in Seneca County with nearby schools including Frank M. Knight Elementary School, Elizabeth Cady Stanton Elementary School, and Seneca Falls Middle School.
Ownership History
Date
Name
Owned For
Owner Type
Purchase Details
Closed on
Oct 11, 2013
Sold by
Dalrymple Michael
Bought by
Didomineck Nicole
Current Estimated Value
Home Financials for this Owner
Home Financials are based on the most recent Mortgage that was taken out on this home.
Original Mortgage
$40,000
Outstanding Balance
$17,578
Interest Rate
4.53%
Mortgage Type
Purchase Money Mortgage
Estimated Equity
$129,558
Purchase Details
Closed on
Apr 5, 1999
Sold by
Buckhout Carole Lee and Buckhout Richard
Bought by
Dalrymple Michael L and Dalrymple Nicole S
Purchase Details
Closed on
May 21, 1997
Sold by
Buffone Rose M
Bought by
Buckhout Richard D and Lee Carole
Create a Home Valuation Report for This Property
The Home Valuation Report is an in-depth analysis detailing your home's value as well as a comparison with similar homes in the area
Home Values in the Area
Average Home Value in this Area
Purchase History
| Date | Buyer | Sale Price | Title Company |
|---|---|---|---|
| Didomineck Nicole | -- | Christi Miller | |
| Dalrymple Michael L | $39,500 | -- | |
| Buckhout Richard D | $33,000 | -- |
Source: Public Records
Mortgage History
| Date | Status | Borrower | Loan Amount |
|---|---|---|---|
| Open | Didomineck Nicole | $40,000 |
Source: Public Records
Tax History Compared to Growth
Tax History
| Year | Tax Paid | Tax Assessment Tax Assessment Total Assessment is a certain percentage of the fair market value that is determined by local assessors to be the total taxable value of land and additions on the property. | Land | Improvement |
|---|---|---|---|---|
| 2024 | $3,460 | $97,000 | $20,600 | $76,400 |
| 2023 | $2,839 | $97,000 | $20,600 | $76,400 |
| 2022 | $2,021 | $43,700 | $15,000 | $28,700 |
| 2021 | $2,007 | $43,700 | $15,000 | $28,700 |
| 2020 | $2,002 | $43,700 | $15,000 | $28,700 |
| 2019 | $822 | $43,700 | $15,000 | $28,700 |
| 2018 | $1,941 | $43,700 | $15,000 | $28,700 |
| 2017 | $1,923 | $43,700 | $15,000 | $28,700 |
| 2016 | $1,650 | $43,700 | $15,000 | $28,700 |
| 2015 | -- | $50,000 | $16,600 | $33,400 |
| 2014 | -- | $50,000 | $16,600 | $33,400 |
Source: Public Records
Map
Nearby Homes