Estimated Value: $1,242,630
2
Beds
1
Bath
1,200
Sq Ft
$1,036/Sq Ft
Est. Value
About This Home
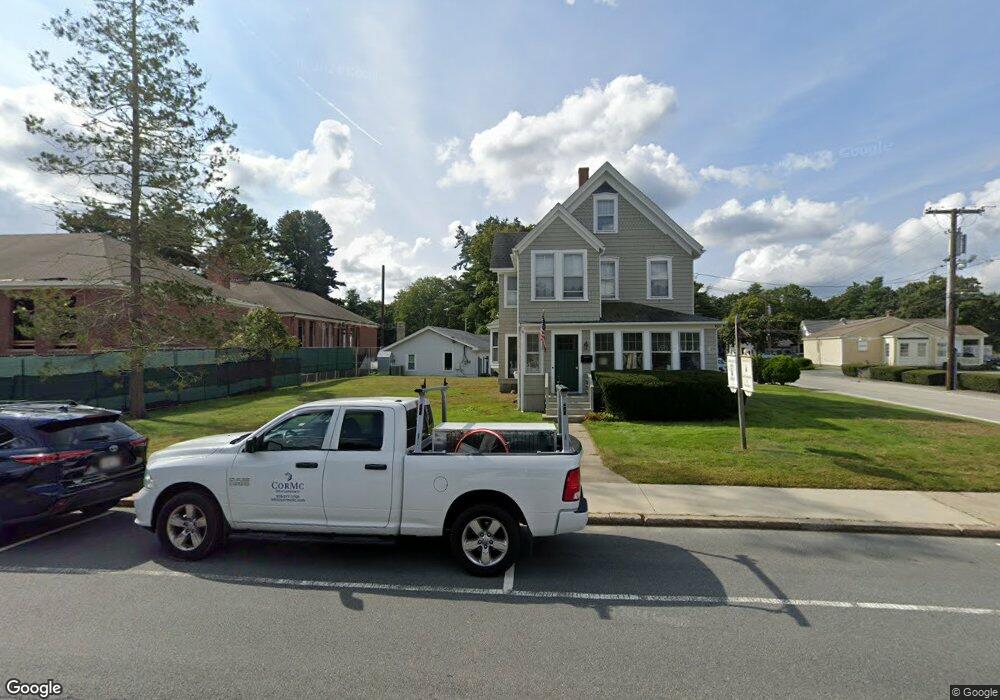
This home is located at 10 Springdale Ave Unit 2, Dover, MA 02030 and is currently estimated at $1,242,630, approximately $1,035 per square foot. 10 Springdale Ave Unit 2 is a home located in Norfolk County with nearby schools including Chickering Elementary School, Dover-Sherborn Regional Middle School, and Dover-Sherborn Regional High School.
Ownership History
Date
Name
Owned For
Owner Type
Purchase Details
Closed on
Jan 27, 2020
Sold by
10 Springdale Avenue Nt
Bought by
Corrigan Development Co
Current Estimated Value
Home Financials for this Owner
Home Financials are based on the most recent Mortgage that was taken out on this home.
Original Mortgage
$772,500
Outstanding Balance
$685,290
Interest Rate
3.7%
Mortgage Type
Purchase Money Mortgage
Estimated Equity
$560,713
Purchase Details
Closed on
Jul 8, 2016
Sold by
10 Springdale Avenue L
Bought by
10 Springsale Avenue N
Purchase Details
Closed on
Jun 20, 2008
Sold by
10 Springdale Avenue N and Hughes John M
Bought by
10 Springdale Avenue L
Home Financials for this Owner
Home Financials are based on the most recent Mortgage that was taken out on this home.
Original Mortgage
$550,000
Interest Rate
6.1%
Mortgage Type
Commercial
Create a Home Valuation Report for This Property
The Home Valuation Report is an in-depth analysis detailing your home's value as well as a comparison with similar homes in the area
Home Values in the Area
Average Home Value in this Area
Purchase History
| Date | Buyer | Sale Price | Title Company |
|---|---|---|---|
| Corrigan Development Co | $850,000 | None Available | |
| 10 Springsale Avenue N | -- | -- | |
| 10 Springdale Avenue L | -- | -- |
Source: Public Records
Mortgage History
| Date | Status | Borrower | Loan Amount |
|---|---|---|---|
| Open | Corrigan Development Co | $772,500 | |
| Previous Owner | 10 Springdale Avenue L | $550,000 |
Source: Public Records
Tax History
| Year | Tax Paid | Tax Assessment Tax Assessment Total Assessment is a certain percentage of the fair market value that is determined by local assessors to be the total taxable value of land and additions on the property. | Land | Improvement |
|---|---|---|---|---|
| 2025 | $9,143 | $811,300 | $0 | $811,300 |
| 2024 | $8,892 | $811,300 | $0 | $811,300 |
| 2023 | $8,023 | $658,200 | $0 | $658,200 |
| 2022 | $8,175 | $658,200 | $0 | $658,200 |
| 2021 | $8,484 | $658,200 | $0 | $658,200 |
| 2020 | $8,451 | $658,200 | $0 | $658,200 |
| 2019 | $8,511 | $658,200 | $0 | $658,200 |
| 2018 | $8,426 | $656,200 | $0 | $656,200 |
| 2017 | $8,125 | $622,600 | $0 | $622,600 |
| 2016 | $8,019 | $622,600 | $0 | $622,600 |
| 2015 | $7,907 | $622,600 | $0 | $622,600 |
Source: Public Records
Map
Nearby Homes
- 10 Springdale Ave
- 4 Whiting Rd
- 14 Springdale Ave
- 7 Whiting Rd Unit 1
- 1 Clover Cir
- 3 Clover Cir Unit 3
- 3 Clover Cir
- 3 Clover Cir
- 2 Clover Cir
- 0 Walpole St - Lot 1 Unit 50351107
- 5 Clover Cir
- 1 Walpole St
- 1 Hawthorne Ln Unit 2
- 1 Hawthorne Ln
- 32 Dedham St
- 4 Clover Cir
- 63 Centre St
- 63 Centre St
- 7 Clover Cir
- 63a Centre St
Your Personal Tour Guide
Ask me questions while you tour the home.