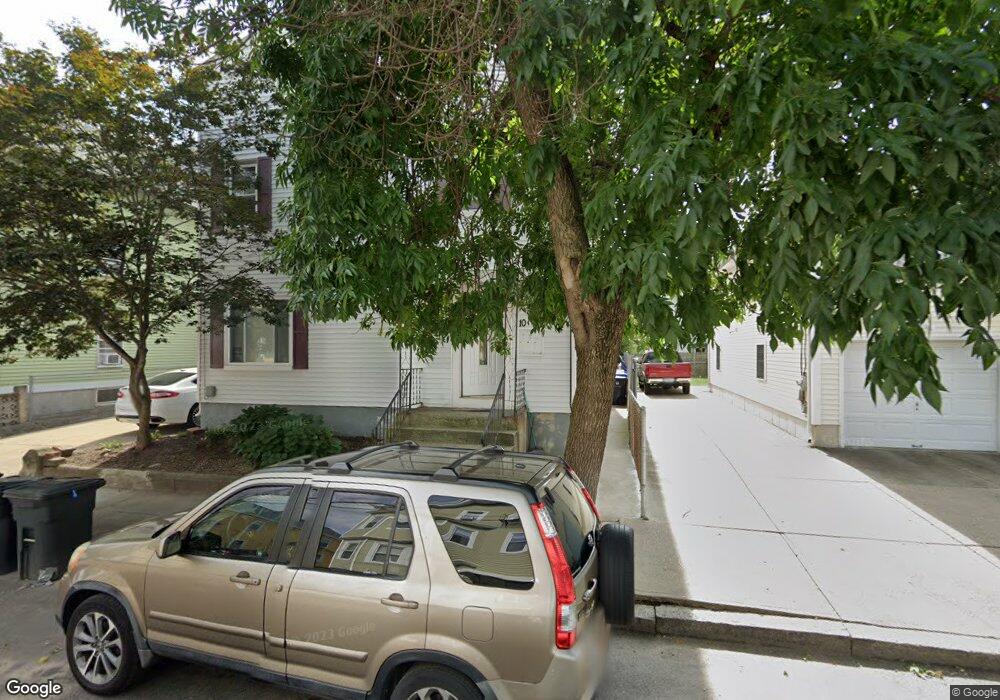
10 Star St Pawtucket, RI 02860
Downtown Pawtucket NeighborhoodEstimated Value: $417,099 - $621,000
5
Beds
4
Baths
3,557
Sq Ft
$156/Sq Ft
Est. Value
About This Home
This home is located at 10 Star St, Pawtucket, RI 02860 and is currently estimated at $556,275, approximately $156 per square foot. 10 Star St is a home located in Providence County with nearby schools including International Charter School, Blackstone Valley Prep Junior High School, and Blackstone Academy Charter School.
Ownership History
Date
Name
Owned For
Owner Type
Purchase Details
Closed on
Jan 31, 1997
Sold by
Farinho Antonio S and Farinho Isabel
Bought by
Miranda Manuel R and Araujo Angelica R
Current Estimated Value
Home Financials for this Owner
Home Financials are based on the most recent Mortgage that was taken out on this home.
Original Mortgage
$91,500
Interest Rate
7.65%
Create a Home Valuation Report for This Property
The Home Valuation Report is an in-depth analysis detailing your home's value as well as a comparison with similar homes in the area
Home Values in the Area
Average Home Value in this Area
Purchase History
| Date | Buyer | Sale Price | Title Company |
|---|---|---|---|
| Miranda Manuel R | $96,500 | -- |
Source: Public Records
Mortgage History
| Date | Status | Borrower | Loan Amount |
|---|---|---|---|
| Open | Miranda Manuel R | $18,748 | |
| Open | Miranda Manuel R | $200,988 | |
| Closed | Miranda Manuel R | $91,500 |
Source: Public Records
Tax History Compared to Growth
Tax History
| Year | Tax Paid | Tax Assessment Tax Assessment Total Assessment is a certain percentage of the fair market value that is determined by local assessors to be the total taxable value of land and additions on the property. | Land | Improvement |
|---|---|---|---|---|
| 2025 | $5,932 | $451,100 | $117,700 | $333,400 |
| 2024 | $5,567 | $451,100 | $117,700 | $333,400 |
| 2023 | $4,581 | $270,400 | $53,000 | $217,400 |
| 2022 | $4,483 | $270,400 | $53,000 | $217,400 |
| 2021 | $4,483 | $270,400 | $53,000 | $217,400 |
| 2020 | $3,823 | $183,000 | $53,600 | $129,400 |
| 2019 | $3,823 | $183,000 | $53,600 | $129,400 |
| 2018 | $3,684 | $183,000 | $53,600 | $129,400 |
| 2017 | $3,490 | $153,600 | $40,600 | $113,000 |
| 2016 | $3,362 | $153,600 | $40,600 | $113,000 |
| 2015 | $3,362 | $153,600 | $40,600 | $113,000 |
| 2014 | $2,931 | $127,100 | $52,200 | $74,900 |
Source: Public Records
Map
Nearby Homes