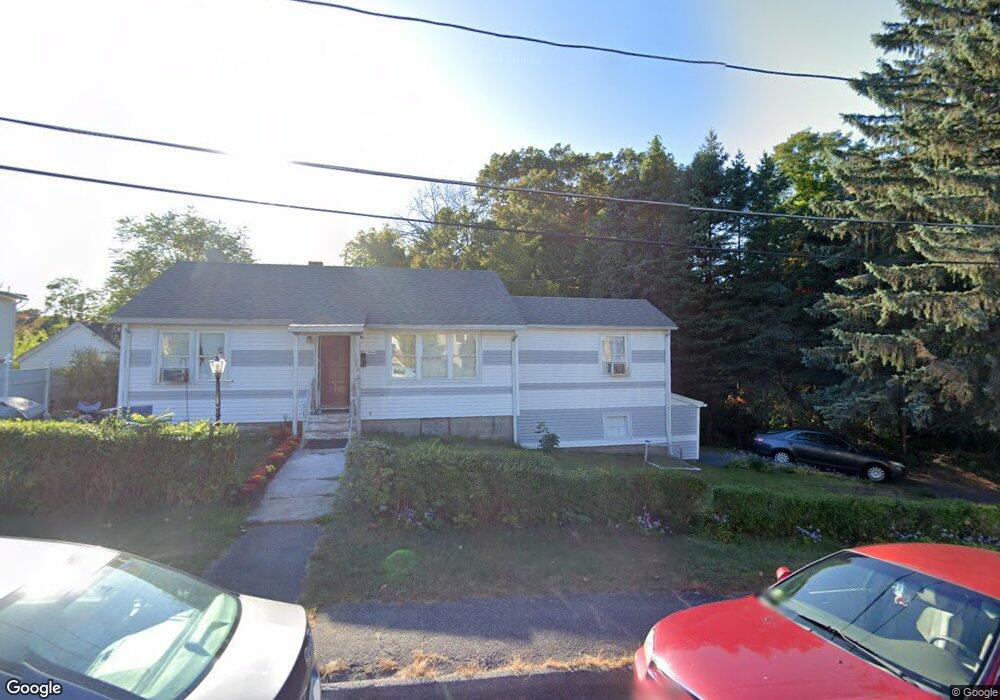
10 Sumner St Auburn, MA 01501
Stoneville NeighborhoodEstimated Value: $341,802 - $384,000
2
Beds
2
Baths
984
Sq Ft
$367/Sq Ft
Est. Value
About This Home
This home is located at 10 Sumner St, Auburn, MA 01501 and is currently estimated at $361,451, approximately $367 per square foot. 10 Sumner St is a home located in Worcester County with nearby schools including Auburn Senior High School, Canterbury Street School, and Shrewsbury Montessori School - Auburn Campus.
Ownership History
Date
Name
Owned For
Owner Type
Purchase Details
Closed on
Nov 9, 1999
Sold by
Est Grace Milton and Longwell Arthur R
Bought by
Robichaud Homer R and Robichaud Sally A
Current Estimated Value
Home Financials for this Owner
Home Financials are based on the most recent Mortgage that was taken out on this home.
Original Mortgage
$103,550
Outstanding Balance
$31,564
Interest Rate
7.73%
Mortgage Type
Purchase Money Mortgage
Estimated Equity
$329,887
Create a Home Valuation Report for This Property
The Home Valuation Report is an in-depth analysis detailing your home's value as well as a comparison with similar homes in the area
Home Values in the Area
Average Home Value in this Area
Purchase History
| Date | Buyer | Sale Price | Title Company |
|---|---|---|---|
| Robichaud Homer R | $109,000 | -- |
Source: Public Records
Mortgage History
| Date | Status | Borrower | Loan Amount |
|---|---|---|---|
| Open | Robichaud Homer R | $103,550 |
Source: Public Records
Tax History
| Year | Tax Paid | Tax Assessment Tax Assessment Total Assessment is a certain percentage of the fair market value that is determined by local assessors to be the total taxable value of land and additions on the property. | Land | Improvement |
|---|---|---|---|---|
| 2025 | $40 | $281,200 | $109,600 | $171,600 |
| 2024 | $3,913 | $262,100 | $103,400 | $158,700 |
| 2023 | $3,787 | $238,500 | $94,000 | $144,500 |
| 2022 | $3,583 | $213,000 | $94,000 | $119,000 |
| 2021 | $3,345 | $184,400 | $82,900 | $101,500 |
| 2020 | $3,316 | $184,400 | $82,900 | $101,500 |
| 2019 | $3,209 | $174,200 | $82,100 | $92,100 |
| 2018 | $2,987 | $162,000 | $76,800 | $85,200 |
| 2017 | $2,839 | $154,800 | $69,600 | $85,200 |
| 2016 | $2,710 | $149,800 | $71,500 | $78,300 |
| 2015 | $2,613 | $151,400 | $71,500 | $79,900 |
| 2014 | $2,448 | $141,600 | $68,100 | $73,500 |
Source: Public Records
Map
Nearby Homes
- 99 Clover St
- 5 Commonwealth Ave
- 177 Boyce St
- 25 Vinal St Unit 28
- 25 Vinal St Unit 26
- 25 Vinal St Unit 29
- 25 Vinal St Unit 30
- 11 Hulbert Rd Unit 13
- 35 Genessee St Unit E
- 103 Henshaw St
- 177 Oxford St N
- 1034 Southbridge St
- 27 Havana Rd
- 204-212 Hampton St
- 55 Grandview Ave
- 154 Pakachoag St
- 315 Stafford St
- 501 Forest Park Dr Unit 501
- 26 Sylvan St
- 19-20 Williams St
Your Personal Tour Guide
Ask me questions while you tour the home.