
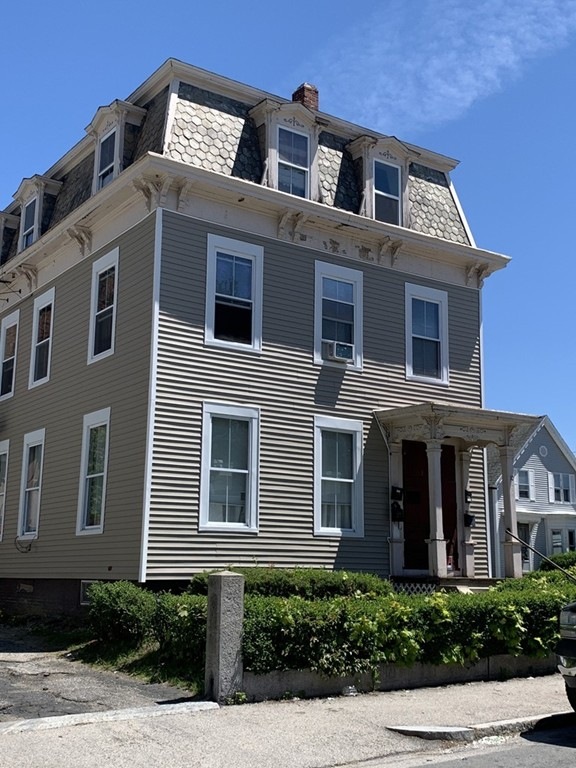
10 Sycamore St Worcester, MA 01608
Downtown Worcester Neighborhood
8
Beds
3
Baths
3,408
Sq Ft
4,792
Sq Ft Lot
Highlights
- Barn or Stable
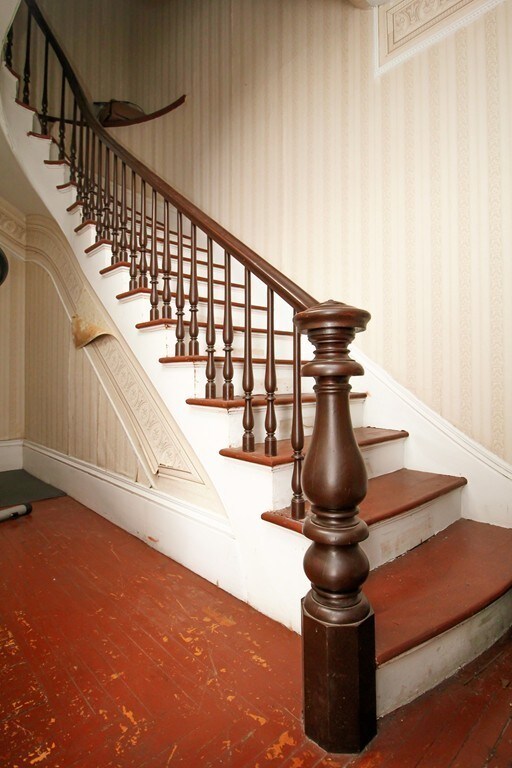
- Wood Flooring
- Garden
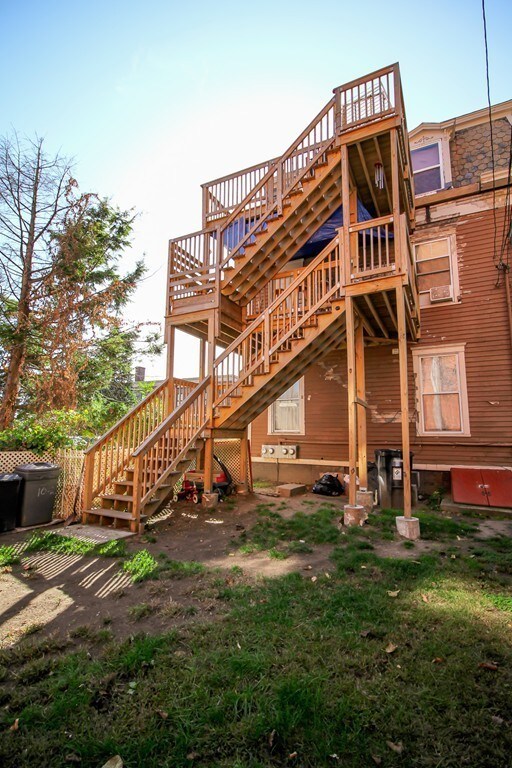
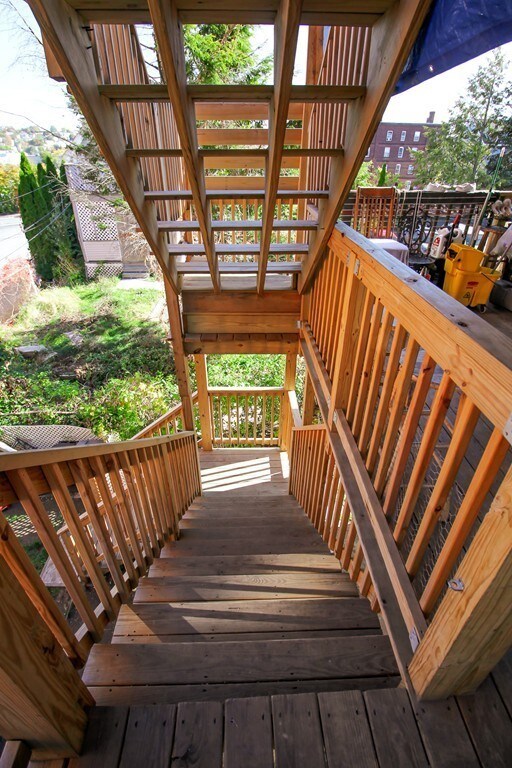
- Deck
About This Home
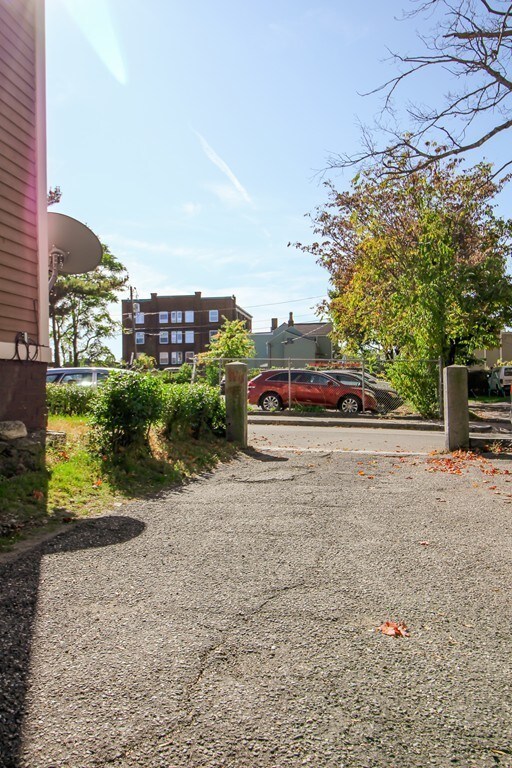
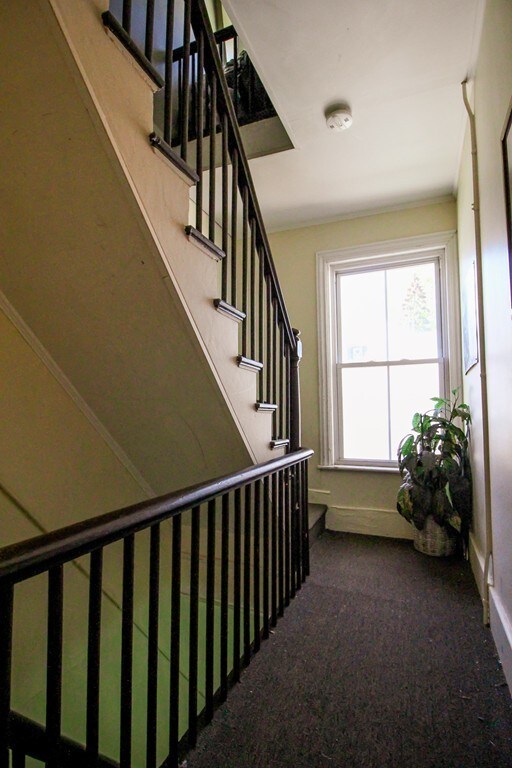
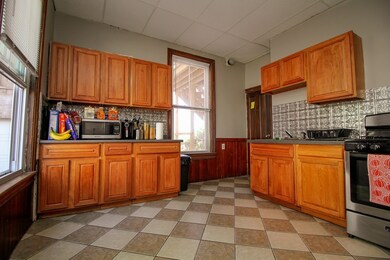
As of September 2023** 3 Family Home opportunity ** This house offers a new siding, new deck, replacement windows. Efficient gas forced hot air heating system in each unit. Separate utilities and circuit breakers including landlords meter. Coin operated washer and dryer in the basement. Heated 2 story barn with a garage and lots of room for storage. Paved driveway for off street parking. Lead certificate of compliance in hand for all 3 units. Walking distance to the future Polar Park. This house is fully occupied and showing is limited to the hallways, basement and barn. Units can be viewed with an accepted offer. Agents must accompany your buyer and follow COVID19 protocol.
Last Agent to Sell the Property
BA Property & Lifestyle Advisors Listed on: 05/21/2020
Property Details
Home Type
- Multi-Family
Est. Annual Taxes
- $8,930
Year Built
- Built in 1856
Lot Details
- Year Round Access
- Garden
Parking
- 1 Car Garage
Flooring
- Wood
- Laminate
- Tile
Utilities
- Water Holding Tank
- Natural Gas Water Heater
Additional Features
- Deck
- Barn or Stable
- Basement
Ownership History
Date
Name
Owned For
Owner Type
Purchase Details
Closed on
Mar 24, 2011
Sold by
Sovereign Bk
Bought by
Rubild Massaschusetts
Current Estimated Value
Purchase Details
Closed on
Jul 1, 2010
Sold by
Bourget Timothy and Sovereign Bk
Bought by
Sovereign Bk
Purchase Details
Closed on
Oct 7, 2005
Sold by
Suschyk Paul M and Bonczyk Scott K
Bought by
Bourget Timothy
Home Financials for this Owner
Home Financials are based on the most recent Mortgage that was taken out on this home.
Original Mortgage
$160,000
Interest Rate
5.81%
Mortgage Type
Purchase Money Mortgage
Purchase Details
Closed on
Jan 5, 1995
Sold by
Department Of Housing & Urban Dev
Bought by
Bonczyk Scott K and Bonczyk Valerie
Purchase Details
Closed on
Aug 27, 1993
Sold by
Ferguson Donald R and Cenlar Fed Sb
Bought by
Cenlar Fsb
Purchase Details
Closed on
Dec 23, 1991
Sold by
Kozaczka Stanley
Bought by
Bay Finance Co Inc
Similar Homes in Worcester, MA
Create a Home Valuation Report for This Property
The Home Valuation Report is an in-depth analysis detailing your home's value as well as a comparison with similar homes in the area
Home Values in the Area
Average Home Value in this Area
Purchase History
| Date | Type | Sale Price | Title Company |
|---|---|---|---|
| Deed | $74,900 | -- | |
| Foreclosure Deed | $106,250 | -- | |
| Deed | $200,001 | -- | |
| Deed | $9,000 | -- | |
| Foreclosure Deed | $103,073 | -- | |
| Foreclosure Deed | $735,000 | -- |
Source: Public Records
Mortgage History
| Date | Status | Loan Amount | Loan Type |
|---|---|---|---|
| Open | $565,000 | Stand Alone Refi Refinance Of Original Loan | |
| Closed | $562,500 | Purchase Money Mortgage | |
| Closed | $412,500 | Purchase Money Mortgage | |
| Closed | $100,000 | Credit Line Revolving | |
| Closed | $291,750 | New Conventional | |
| Closed | $160,000 | New Conventional | |
| Closed | $68,000 | No Value Available | |
| Previous Owner | $50,000 | No Value Available | |
| Previous Owner | $160,000 | Purchase Money Mortgage |
Source: Public Records
Property History
| Date | Event | Price | Change | Sq Ft Price |
|---|---|---|---|---|
| 09/22/2023 09/22/23 | Sold | $750,000 | +7.2% | $220 / Sq Ft |
| 08/25/2023 08/25/23 | Pending | -- | -- | -- |
| 08/17/2023 08/17/23 | For Sale | $699,900 | +27.3% | $205 / Sq Ft |
| 06/01/2023 06/01/23 | Sold | $550,000 | 0.0% | $159 / Sq Ft |
| 04/08/2023 04/08/23 | Off Market | $550,000 | -- | -- |
| 03/24/2023 03/24/23 | For Sale | $579,000 | +48.8% | $168 / Sq Ft |
| 07/15/2020 07/15/20 | Sold | $389,000 | 0.0% | $114 / Sq Ft |
| 05/28/2020 05/28/20 | Pending | -- | -- | -- |
| 05/21/2020 05/21/20 | For Sale | $389,000 | -30.5% | $114 / Sq Ft |
| 02/15/2019 02/15/19 | Sold | $559,900 | 0.0% | $294 / Sq Ft |
| 08/21/2018 08/21/18 | Pending | -- | -- | -- |
| 08/09/2018 08/09/18 | For Sale | $559,900 | 0.0% | $294 / Sq Ft |
| 05/11/2018 05/11/18 | Pending | -- | -- | -- |
| 12/28/2017 12/28/17 | For Sale | $559,900 | +327.4% | $294 / Sq Ft |
| 08/09/2013 08/09/13 | Sold | $131,000 | -22.9% | $38 / Sq Ft |
| 07/10/2013 07/10/13 | Pending | -- | -- | -- |
| 02/21/2013 02/21/13 | For Sale | $169,900 | +136.0% | $50 / Sq Ft |
| 02/14/2012 02/14/12 | Sold | $72,000 | -27.9% | $21 / Sq Ft |
| 01/15/2012 01/15/12 | Pending | -- | -- | -- |
| 12/21/2011 12/21/11 | For Sale | $99,900 | -- | $30 / Sq Ft |
Source: MLS Property Information Network (MLS PIN)
Tax History Compared to Growth
Tax History
| Year | Tax Paid | Tax Assessment Tax Assessment Total Assessment is a certain percentage of the fair market value that is determined by local assessors to be the total taxable value of land and additions on the property. | Land | Improvement |
|---|---|---|---|---|
| 2025 | $8,930 | $677,000 | $53,800 | $623,200 |
| 2024 | $6,249 | $454,500 | $53,800 | $400,700 |
| 2023 | $5,954 | $415,200 | $42,500 | $372,700 |
| 2022 | $5,217 | $343,000 | $34,000 | $309,000 |
| 2021 | $4,567 | $280,500 | $27,200 | $253,300 |
| 2020 | $2,839 | $167,000 | $27,200 | $139,800 |
| 2019 | $2,873 | $159,600 | $25,900 | $133,700 |
| 2018 | $2,810 | $148,600 | $25,900 | $122,700 |
| 2017 | $2,637 | $137,200 | $25,900 | $111,300 |
| 2016 | $2,508 | $121,700 | $18,200 | $103,500 |
| 2015 | $2,443 | $121,700 | $18,200 | $103,500 |
| 2014 | $2,378 | $121,700 | $18,200 | $103,500 |
Source: Public Records
Agents Affiliated with this Home
-
A
Seller's Agent in 2023
Alexis Cardoso
Residential Properties Ltd.
(401) 659-7298
1 in this area
70 Total Sales
-
S
Seller's Agent in 2023
Scott Dennett
Keller Williams Pinnacle Central
(401) 333-4900
1 in this area
3 Total Sales
-
T
Seller Co-Listing Agent in 2023
Thy-Nguyen Tran
eXp Realty
(617) 840-4915
1 in this area
2 Total Sales
-
N
Buyer's Agent in 2023
Non-Mls Member
Non-Mls Member
-
T
Buyer's Agent in 2023
Thy Tran
eXp Realty
2 in this area
3 Total Sales
-
Seller's Agent in 2020
Juliana O'Brien
BA Property & Lifestyle Advisors
(508) 333-6933
39 Total Sales
Map
Source: MLS Property Information Network (MLS PIN)
MLS Number: 72660070
APN: WORC-000003-000009-000008
Disclaimer: Certain information contained herein is derived from information provided by parties other than Homes.com. All information provided is deemed reliable, but is not guaranteed to be accurate and should be independently verified.
![]() The property listing data and information, or the Images, set forth herein were provided to MLS Property Information Network, Inc. from third party sources, including sellers, lessors and public records, and were compiled by MLS Property Information Network, Inc. The property listing data and information, and the Images, are for the personal, non-commercial use of consumers having a good faith interest in purchasing or leasing listed properties of the type displayed to them and may not be used for any purpose other than to identify prospective properties which such consumers may have a good faith interest in purchasing or leasing. MLS Property Information Network, Inc. and its subscribers disclaim any and all representations and warranties as to the accuracy of the property listing data and information, or as to the accuracy of any of the Images, set forth herein.
The property listing data and information, or the Images, set forth herein were provided to MLS Property Information Network, Inc. from third party sources, including sellers, lessors and public records, and were compiled by MLS Property Information Network, Inc. The property listing data and information, and the Images, are for the personal, non-commercial use of consumers having a good faith interest in purchasing or leasing listed properties of the type displayed to them and may not be used for any purpose other than to identify prospective properties which such consumers may have a good faith interest in purchasing or leasing. MLS Property Information Network, Inc. and its subscribers disclaim any and all representations and warranties as to the accuracy of the property listing data and information, or as to the accuracy of any of the Images, set forth herein.
Nearby Homes
- 70 Southbridge St Unit 310
- 70 Southbridge St Unit 705
- 70 Southbridge St Unit 409
- 70 Southbridge St Unit 915
- 531 Main St Unit 410
- 531 Main St Unit 201
- 6 Chatham Place Unit 6
- 17 Federal St Unit 211
- 21 Lodi St
- 69 Oread St
- 80 Chatham St
- 84 Chatham St
- 104 Pleasant St
- 2 Oxford Place
- 146 -152 Chandler
- 10 Lamartine St
- 230 Pleasant St
- 44 Elm St Unit 107
- 146 Beacon St
- 1 Cottage St