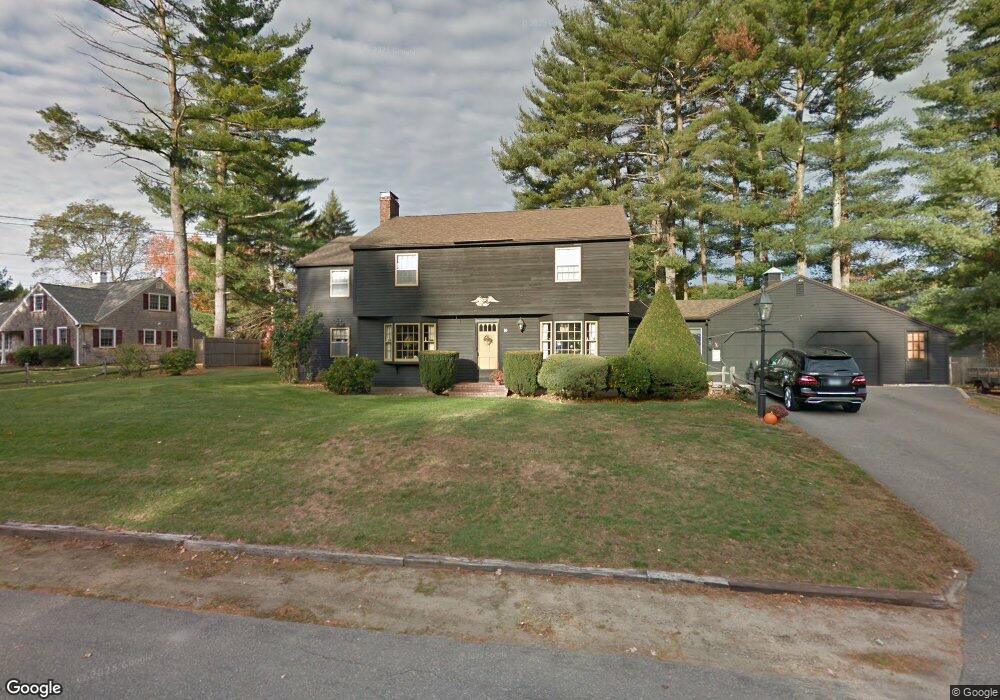
10 Sylvan Rd North Hampton, NH 03862
Estimated Value: $787,989 - $887,000
--
Bed
3
Baths
2,462
Sq Ft
$339/Sq Ft
Est. Value
About This Home
This home is located at 10 Sylvan Rd, North Hampton, NH 03862 and is currently estimated at $833,497, approximately $338 per square foot. 10 Sylvan Rd is a home with nearby schools including North Hampton School, Winnacunnet High School, and Sacred Heart School.
Ownership History
Date
Name
Owned For
Owner Type
Purchase Details
Closed on
Nov 29, 2021
Sold by
J H & M L Downey Ret
Bought by
Downey Richard and Downey Lisa
Current Estimated Value
Create a Home Valuation Report for This Property
The Home Valuation Report is an in-depth analysis detailing your home's value as well as a comparison with similar homes in the area
Home Values in the Area
Average Home Value in this Area
Purchase History
| Date | Buyer | Sale Price | Title Company |
|---|---|---|---|
| Downey Richard | $648,000 | None Available |
Source: Public Records
Tax History Compared to Growth
Tax History
| Year | Tax Paid | Tax Assessment Tax Assessment Total Assessment is a certain percentage of the fair market value that is determined by local assessors to be the total taxable value of land and additions on the property. | Land | Improvement |
|---|---|---|---|---|
| 2024 | $7,562 | $590,800 | $238,500 | $352,300 |
| 2023 | $7,355 | $590,800 | $238,500 | $352,300 |
| 2022 | $6,887 | $401,100 | $174,900 | $226,200 |
| 2021 | $6,646 | $401,100 | $174,900 | $226,200 |
| 2020 | $1,211 | $401,100 | $174,900 | $226,200 |
| 2019 | $4,746 | $401,100 | $174,900 | $226,200 |
| 2018 | $6,514 | $401,100 | $174,900 | $226,200 |
| 2017 | $4,560 | $321,500 | $145,700 | $175,800 |
| 2016 | $1,317 | $321,500 | $145,700 | $175,800 |
| 2015 | $5,620 | $321,500 | $145,700 | $175,800 |
| 2014 | $5,482 | $321,500 | $145,700 | $175,800 |
| 2013 | $5,385 | $321,500 | $145,700 | $175,800 |
Source: Public Records
Map
Nearby Homes