10 Temple Ave Unit 12 Hackensack, NJ 07601
Estimated Value: $663,000 - $800,000
Studio
--
Bath
2,392
Sq Ft
$309/Sq Ft
Est. Value
About This Home
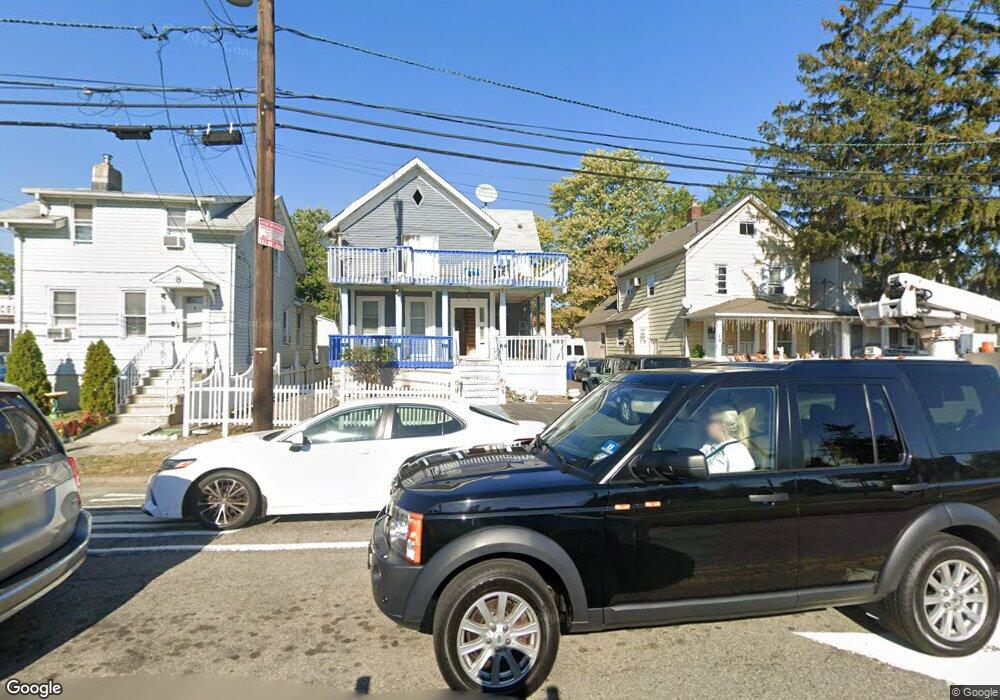
This home is located at 10 Temple Ave Unit 12, Hackensack, NJ 07601 and is currently estimated at $739,215, approximately $309 per square foot. 10 Temple Ave Unit 12 is a home located in Bergen County with nearby schools including Hackensack High School, Teaneck Community Charter School, and Bergen County Christian Academy.
Ownership History
Date
Name
Owned For
Owner Type
Purchase Details
Closed on
Apr 22, 2019
Sold by
Diaz Cecilia and Diaz Julian
Bought by
Diaz Cecilia and Diaz Kelvi
Current Estimated Value
Purchase Details
Closed on
Nov 12, 1999
Sold by
Bankers Trust Co
Bought by
Diaz Julian and Diaz Cecilia
Home Financials for this Owner
Home Financials are based on the most recent Mortgage that was taken out on this home.
Original Mortgage
$188,100
Interest Rate
7.83%
Mortgage Type
FHA
Purchase Details
Closed on
Jun 14, 1999
Sold by
Evans Melvin
Bought by
Bankers Trust Company
Purchase Details
Closed on
Mar 26, 1997
Sold by
D'Elia Joseph and D'Elia Josephine
Bought by
Evans Melvin
Home Financials for this Owner
Home Financials are based on the most recent Mortgage that was taken out on this home.
Original Mortgage
$172,000
Interest Rate
7.55%
Purchase Details
Closed on
Oct 27, 1995
Sold by
Carramusa Salvatore and Carramusa Filippa
Bought by
D'Elia Joseph and D'Elia Josephine
Create a Home Valuation Report for This Property
The Home Valuation Report is an in-depth analysis detailing your home's value as well as a comparison with similar homes in the area
Home Values in the Area
Average Home Value in this Area
Purchase History
| Date | Buyer | Sale Price | Title Company |
|---|---|---|---|
| Diaz Cecilia | -- | -- | |
| Diaz Julian | $214,000 | -- | |
| Bankers Trust Company | -- | -- | |
| Evans Melvin | $215,000 | -- | |
| D'Elia Joseph | $195,000 | -- |
Source: Public Records
Mortgage History
| Date | Status | Borrower | Loan Amount |
|---|---|---|---|
| Previous Owner | Diaz Julian | $188,100 | |
| Previous Owner | Evans Melvin | $172,000 |
Source: Public Records
Tax History
| Year | Tax Paid | Tax Assessment Tax Assessment Total Assessment is a certain percentage of the fair market value that is determined by local assessors to be the total taxable value of land and additions on the property. | Land | Improvement |
|---|---|---|---|---|
| 2025 | $14,213 | $465,100 | $188,600 | $276,500 |
| 2024 | $13,390 | $465,100 | $188,600 | $276,500 |
| 2023 | $13,307 | $465,100 | $188,600 | $276,500 |
| 2022 | $13,307 | $474,900 | $181,400 | $293,500 |
| 2021 | $12,928 | $385,000 | $152,100 | $232,900 |
| 2020 | $12,740 | $385,000 | $152,100 | $232,900 |
| 2019 | $12,726 | $379,100 | $149,800 | $229,300 |
| 2018 | $12,768 | $374,100 | $146,700 | $227,400 |
| 2017 | $12,574 | $368,200 | $144,400 | $223,800 |
| 2016 | $11,857 | $351,000 | $130,900 | $220,100 |
| 2015 | $14,151 | $404,300 | $170,100 | $234,200 |
| 2014 | $13,431 | $404,300 | $170,100 | $234,200 |
Source: Public Records
Map
Nearby Homes
- 150 Grand Ave Unit 1A
- 81 Fairmount Ave
- 75 Pine St
- 140 Euclid Ave Unit 6E
- 140 Euclid Ave Unit 1G
- 32 Martin Terrace
- 67 Spring Valley Ave
- 26 van Orden Place
- 258 Clinton Place
- 15 Zabriskie St Unit 1505
- 258 Ross Ave
- 55 Clinton Place Unit 502
- 300 Lookout Ave Unit C4
- 95 Cedar Ave
- 208 Anderson St Unit S5A
- 208 Anderson St Unit S4C
- 208 Anderson St
- 208 Anderson St Unit S4F
- 208 Anderson St Unit 7SG
- 120 Louis St
- 14 Temple Ave
- 8 Temple Ave
- 16 Temple Ave
- 6 Temple Ave
- 10 Johnson Ave
- 691 Main St
- 20 Johnson Ave
- 24 Johnson Ave
- 18 Johnson Ave
- 22 Johnson Ave Unit 22
- 22 Johnson Ave Unit 20
- 22 Johnson Ave
- 699 Main St
- 683 Main St
- 683 Main St Unit 22
- 683 Main St Unit 2
- 683 Main St
- 705 Main St Unit 2D
- 705 Main St
- 705 Main St Unit 2B
Your Personal Tour Guide
Ask me questions while you tour the home.