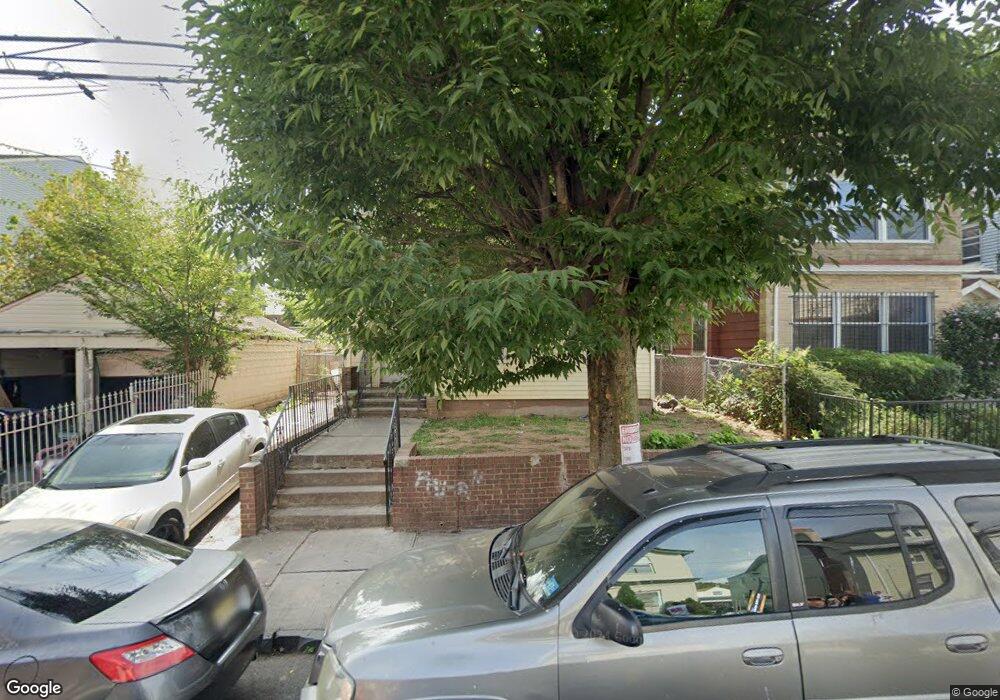
10 Tillinghast St Newark, NJ 07108
Clinton Hill NeighborhoodEstimated Value: $524,521 - $621,000
--
Bed
--
Bath
2,389
Sq Ft
$238/Sq Ft
Est. Value
About This Home
This home is located at 10 Tillinghast St, Newark, NJ 07108 and is currently estimated at $568,380, approximately $237 per square foot. 10 Tillinghast St is a home located in Essex County with nearby schools including Hawthorne Avenue Elementary School, Belmont Runyon School, and Peshine Avenue Elementary School.
Ownership History
Date
Name
Owned For
Owner Type
Purchase Details
Closed on
Oct 9, 2024
Sold by
Delaware Investments Moh 1 Llc
Bought by
Swb Equities Nine Llc
Current Estimated Value
Home Financials for this Owner
Home Financials are based on the most recent Mortgage that was taken out on this home.
Original Mortgage
$495,000
Outstanding Balance
$489,566
Interest Rate
6.12%
Mortgage Type
New Conventional
Estimated Equity
$78,814
Purchase Details
Closed on
Sep 11, 2019
Sold by
Cap Moc 10 Tillinghast
Bought by
Delaware Invests Moh 1
Purchase Details
Closed on
Mar 9, 2006
Sold by
Taylor Shakima
Bought by
Can Alpay
Home Financials for this Owner
Home Financials are based on the most recent Mortgage that was taken out on this home.
Original Mortgage
$259,900
Interest Rate
1%
Mortgage Type
Adjustable Rate Mortgage/ARM
Purchase Details
Closed on
Aug 30, 2004
Sold by
Moody Bernice
Bought by
White Ballam
Create a Home Valuation Report for This Property
The Home Valuation Report is an in-depth analysis detailing your home's value as well as a comparison with similar homes in the area
Home Values in the Area
Average Home Value in this Area
Purchase History
| Date | Buyer | Sale Price | Title Company |
|---|---|---|---|
| Swb Equities Nine Llc | -- | Skyview Title | |
| Swb Equities Nine Llc | -- | Skyview Title | |
| Delaware Invests Moh 1 | -- | Stewart Title | |
| Can Alpay | $324,900 | -- | |
| -- | $324,000 | -- | |
| White Ballam | $155,000 | -- |
Source: Public Records
Mortgage History
| Date | Status | Borrower | Loan Amount |
|---|---|---|---|
| Open | Swb Equities Nine Llc | $495,000 | |
| Closed | Swb Equities Nine Llc | $495,000 | |
| Previous Owner | -- | $259,900 |
Source: Public Records
Tax History Compared to Growth
Tax History
| Year | Tax Paid | Tax Assessment Tax Assessment Total Assessment is a certain percentage of the fair market value that is determined by local assessors to be the total taxable value of land and additions on the property. | Land | Improvement |
|---|---|---|---|---|
| 2025 | $6,658 | $178,600 | $31,000 | $147,600 |
| 2024 | $6,658 | $178,600 | $31,000 | $147,600 |
| 2022 | $6,673 | $178,600 | $31,000 | $147,600 |
| 2021 | $6,669 | $178,600 | $31,000 | $147,600 |
| 2020 | $6,787 | $178,600 | $31,000 | $147,600 |
| 2019 | $4,299 | $114,300 | $31,000 | $83,300 |
| 2018 | $4,221 | $114,300 | $31,000 | $83,300 |
| 2017 | $4,069 | $114,300 | $31,000 | $83,300 |
| 2016 | $3,932 | $114,300 | $31,000 | $83,300 |
| 2015 | $3,782 | $114,300 | $31,000 | $83,300 |
| 2014 | $3,544 | $114,300 | $31,000 | $83,300 |
Source: Public Records
Map
Nearby Homes
- 119 Osborne Terrace
- 121 Osborne Terrace
- 119-121 Osborne Terrace
- 137 Osborne Terrace
- 343-345 Hawthorne Ave
- 274 W Runyon St
- 87 Osborne Terrace
- 85 Osborne Terrace Unit 87
- 280 W Runyon St
- 282 W Runyon St
- 138 Hedden Terrace
- 21 Huntington Terrace
- 297 W Runyon St
- 28 Schuyler Ave
- 303-305 W Runyon St
- 173 Seymour Ave
- 184 Seymour Ave
- 45-47 Hedden Terrace
- 45 Hedden Terrace Unit 47
- 168 Seymour Ave
- 12 Tillinghast St Unit 14
- 16 Tillinghast St
- 131 Osborne Terrace Unit 2F
- 131 Osborne Terrace Unit 2R
- 131 Osborne Terrace
- 139 Osborne Terrace
- 18 Tillinghast St
- 133-135 Osborne Terrace
- 20 Tillinghast St Unit 22
- 125 Osborne Terrace Unit 17
- 125 Osborne Terrace
- 125 Osborne Terrace Unit Bsmt
- 125 Osborne Terrace Unit 15
- 125 Osborne Terrace Unit 13
- 125 Osborne Terrace Unit 11
- 125 Osborne Terrace Unit 1
- 125 Osborne Terrace Unit 16
- 9 Tillinghast St
- 9 Tillinghast St Unit 3
- 333 Hawthorne Ave Unit 335