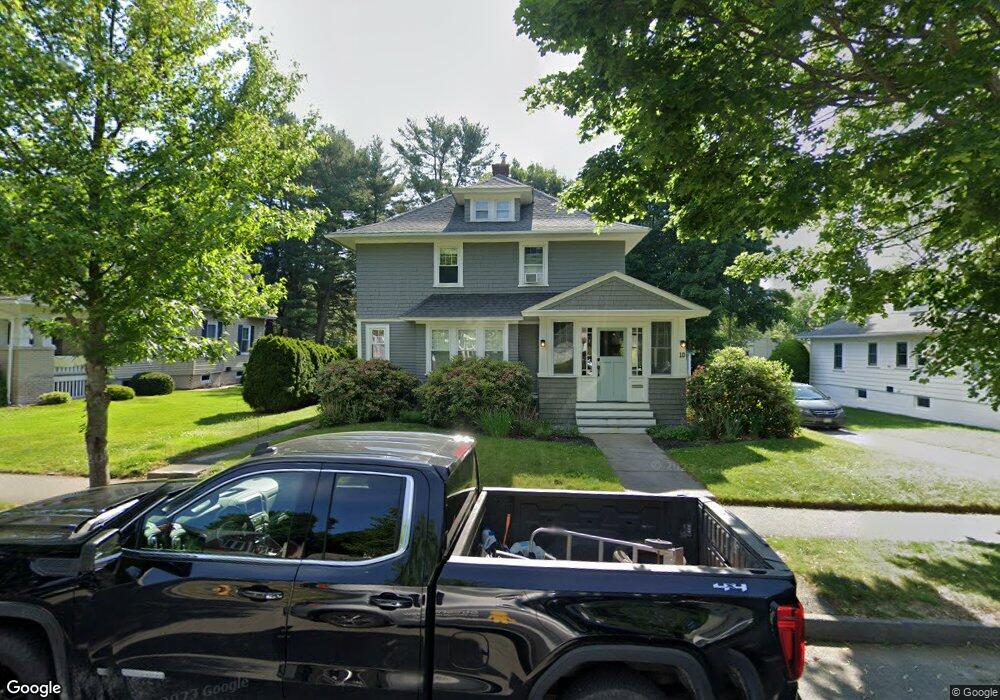
10 Vassar St Worcester, MA 01602
Newton Square NeighborhoodEstimated Value: $477,000 - $532,000
4
Beds
2
Baths
1,868
Sq Ft
$272/Sq Ft
Est. Value
About This Home
This home is located at 10 Vassar St, Worcester, MA 01602 and is currently estimated at $507,973, approximately $271 per square foot. 10 Vassar St is a home located in Worcester County with nearby schools including Chandler Magnet, Jacob Hiatt Magnet School, and Flagg Street School.
Ownership History
Date
Name
Owned For
Owner Type
Purchase Details
Closed on
May 18, 2006
Sold by
Remington Renee F
Bought by
Hogan Christy M and Hogan Sean P
Current Estimated Value
Home Financials for this Owner
Home Financials are based on the most recent Mortgage that was taken out on this home.
Original Mortgage
$110,000
Outstanding Balance
$63,780
Interest Rate
6.42%
Mortgage Type
Purchase Money Mortgage
Estimated Equity
$444,193
Purchase Details
Closed on
May 16, 1994
Sold by
Est Helen C Murphy and Power Gerald
Bought by
Remington Patrick and Remington Renee
Create a Home Valuation Report for This Property
The Home Valuation Report is an in-depth analysis detailing your home's value as well as a comparison with similar homes in the area
Home Values in the Area
Average Home Value in this Area
Purchase History
| Date | Buyer | Sale Price | Title Company |
|---|---|---|---|
| Hogan Christy M | $270,000 | -- | |
| Remington Patrick | $85,000 | -- |
Source: Public Records
Mortgage History
| Date | Status | Borrower | Loan Amount |
|---|---|---|---|
| Open | Hogan Christy M | $110,000 | |
| Previous Owner | Remington Patrick | $181,177 | |
| Previous Owner | Remington Patrick | $158,100 | |
| Previous Owner | Remington Patrick | $130,500 |
Source: Public Records
Tax History Compared to Growth
Tax History
| Year | Tax Paid | Tax Assessment Tax Assessment Total Assessment is a certain percentage of the fair market value that is determined by local assessors to be the total taxable value of land and additions on the property. | Land | Improvement |
|---|---|---|---|---|
| 2025 | $5,362 | $406,500 | $118,800 | $287,700 |
| 2024 | $5,258 | $382,400 | $118,800 | $263,600 |
| 2023 | $5,046 | $351,900 | $103,300 | $248,600 |
| 2022 | $4,650 | $305,700 | $82,600 | $223,100 |
| 2021 | $4,474 | $274,800 | $66,100 | $208,700 |
| 2020 | $4,342 | $255,400 | $66,100 | $189,300 |
| 2019 | $4,333 | $240,700 | $59,500 | $181,200 |
| 2018 | $4,311 | $228,000 | $59,500 | $168,500 |
| 2017 | $4,150 | $215,900 | $59,500 | $156,400 |
| 2016 | $4,118 | $199,800 | $43,800 | $156,000 |
| 2015 | $4,010 | $199,800 | $43,800 | $156,000 |
| 2014 | $3,896 | $199,400 | $43,800 | $155,600 |
Source: Public Records
Map
Nearby Homes