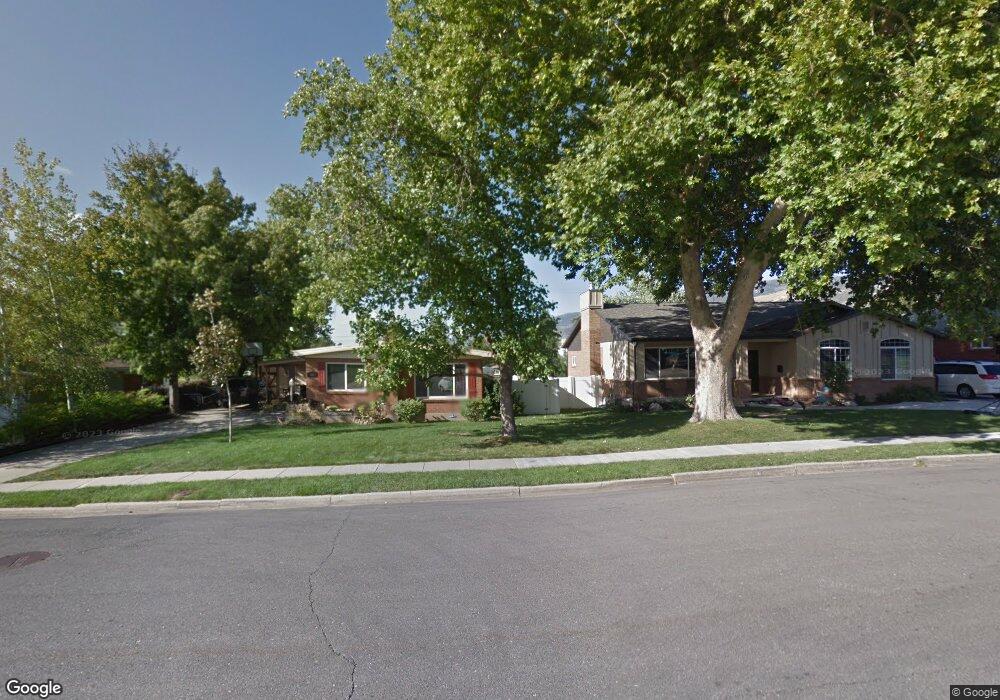
10 W 1600 S Bountiful, UT 84010
Estimated Value: $505,748 - $533,000
3
Beds
2
Baths
2,290
Sq Ft
$227/Sq Ft
Est. Value
About This Home
This home is located at 10 W 1600 S, Bountiful, UT 84010 and is currently estimated at $519,437, approximately $226 per square foot. 10 W 1600 S is a home located in Davis County with nearby schools including Bountiful Elementary School, Mueller Park Junior High School, and Bountiful High School.
Ownership History
Date
Name
Owned For
Owner Type
Purchase Details
Closed on
Oct 14, 2024
Sold by
Robison Ethan L and Robison Kristen I
Bought by
Robison Family Trust and Robison
Current Estimated Value
Purchase Details
Closed on
Jul 9, 1998
Sold by
Murdock Derek N and Eastman Robert C
Bought by
Robison Ethan L and Robison Kristen I
Home Financials for this Owner
Home Financials are based on the most recent Mortgage that was taken out on this home.
Original Mortgage
$114,300
Interest Rate
7.03%
Purchase Details
Closed on
Mar 17, 1997
Sold by
Meredith James
Bought by
Murdock Derek N and Eastman Robert C
Home Financials for this Owner
Home Financials are based on the most recent Mortgage that was taken out on this home.
Original Mortgage
$128,708
Interest Rate
7.9%
Mortgage Type
FHA
Create a Home Valuation Report for This Property
The Home Valuation Report is an in-depth analysis detailing your home's value as well as a comparison with similar homes in the area
Purchase History
| Date | Buyer | Sale Price | Title Company |
|---|---|---|---|
| Robison Family Trust | -- | None Listed On Document | |
| Robison Ethan L | -- | Bonneville Title Company | |
| Murdock Derek N | -- | Bonneville Title Company Inc |
Source: Public Records
Mortgage History
| Date | Status | Borrower | Loan Amount |
|---|---|---|---|
| Previous Owner | Robison Ethan L | $114,300 | |
| Previous Owner | Murdock Derek N | $128,708 |
Source: Public Records
Tax History
| Year | Tax Paid | Tax Assessment Tax Assessment Total Assessment is a certain percentage of the fair market value that is determined by local assessors to be the total taxable value of land and additions on the property. | Land | Improvement |
|---|---|---|---|---|
| 2025 | $444 | $246,400 | $123,558 | $122,842 |
| 2024 | $333 | $238,150 | $107,919 | $130,231 |
| 2023 | $2,423 | $415,000 | $200,887 | $214,113 |
| 2022 | $2,526 | $237,600 | $110,330 | $127,270 |
| 2021 | $459 | $301,000 | $144,291 | $156,709 |
| 2020 | $1,825 | $261,000 | $124,015 | $136,985 |
| 2019 | $1,833 | $256,000 | $136,245 | $119,755 |
| 2018 | $1,705 | $234,000 | $133,676 | $100,324 |
| 2016 | $1,537 | $114,620 | $53,886 | $60,734 |
| 2015 | $1,478 | $103,895 | $53,886 | $50,009 |
| 2014 | $1,605 | $116,990 | $53,886 | $63,104 |
| 2013 | -- | $99,912 | $41,880 | $58,032 |
Source: Public Records
Map
Nearby Homes
- 1820 S 50 W
- 141 E 1650 S
- 1314 S 200 W Unit 19
- 288 E 1650 S
- 1940 S 200 W Unit 3
- 2 E Wicker Ln
- 109 W 900 S
- 2064 S Orchard Dr
- 1950 S 200 W Unit 32
- 380 E 1500 S
- 188 E 2050 S Unit D3
- 285 E 1100 S
- 41 E 2200 S
- 2183 Penman Ln
- 1016 S 400 W
- 2038 S 350 E Unit 3
- 2059 S 350 E Unit 6
- 2046 S 350 E Unit 4
- 295 E 2050 S Unit 1
- 2095 S Main St Unit 13
Your Personal Tour Guide
Ask me questions while you tour the home.