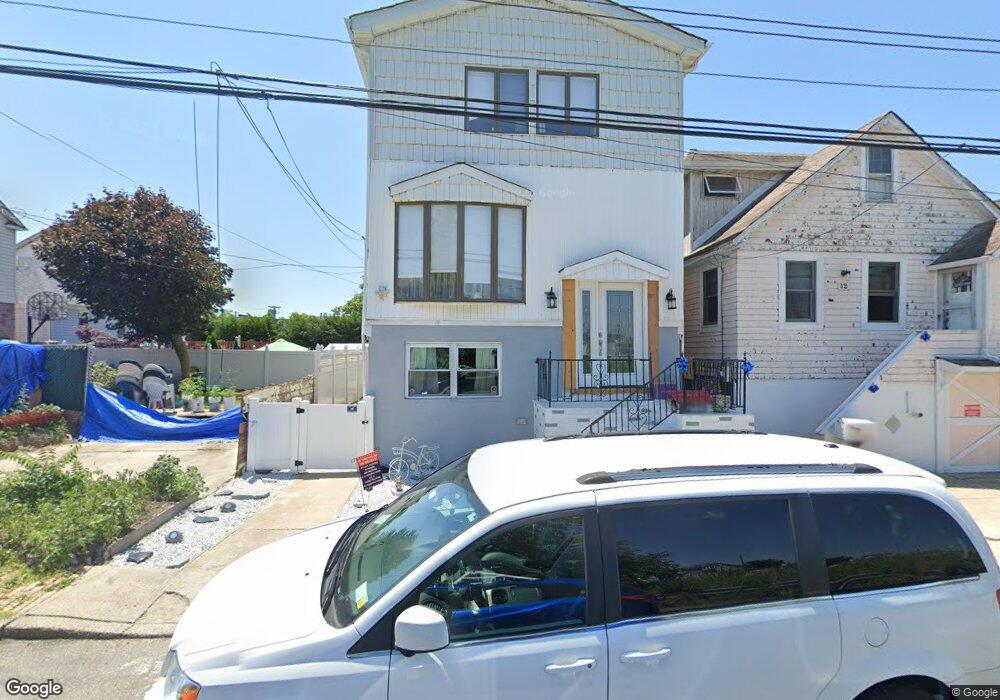
10 W 18th Rd Broad Channel, NY 11693
Broad Channel NeighborhoodEstimated Value: $675,461 - $874,000
4
Beds
2
Baths
1,860
Sq Ft
$410/Sq Ft
Est. Value
About This Home
This home is located at 10 W 18th Rd, Broad Channel, NY 11693 and is currently estimated at $763,365, approximately $410 per square foot. 10 W 18th Rd is a home located in Queens County with nearby schools including P.S. 47 - Chris Galas and St Rose of Lima Catholic Academy.
Ownership History
Date
Name
Owned For
Owner Type
Purchase Details
Closed on
Mar 27, 2018
Sold by
Shlomm Alexander and Shlomm Jennifer
Bought by
Bermingham James and Musco Audra
Current Estimated Value
Purchase Details
Closed on
Mar 30, 2009
Sold by
Shlomm Alexander
Bought by
Shlomm Alexander and Shlomm Jennifer
Home Financials for this Owner
Home Financials are based on the most recent Mortgage that was taken out on this home.
Original Mortgage
$235,000
Interest Rate
4.94%
Mortgage Type
Purchase Money Mortgage
Purchase Details
Closed on
Jul 1, 2004
Sold by
Ott Fred and Ott Joan Ann
Bought by
Shlomm Alexander
Home Financials for this Owner
Home Financials are based on the most recent Mortgage that was taken out on this home.
Original Mortgage
$180,000
Interest Rate
6.25%
Mortgage Type
Purchase Money Mortgage
Create a Home Valuation Report for This Property
The Home Valuation Report is an in-depth analysis detailing your home's value as well as a comparison with similar homes in the area
Home Values in the Area
Average Home Value in this Area
Purchase History
| Date | Buyer | Sale Price | Title Company |
|---|---|---|---|
| Bermingham James | $335,000 | -- | |
| Shlomm Alexander | -- | -- | |
| Shlomm Alexander | $149,466 | -- |
Source: Public Records
Mortgage History
| Date | Status | Borrower | Loan Amount |
|---|---|---|---|
| Previous Owner | Shlomm Alexander | $235,000 | |
| Previous Owner | Shlomm Alexander | $180,000 |
Source: Public Records
Tax History Compared to Growth
Tax History
| Year | Tax Paid | Tax Assessment Tax Assessment Total Assessment is a certain percentage of the fair market value that is determined by local assessors to be the total taxable value of land and additions on the property. | Land | Improvement |
|---|---|---|---|---|
| 2025 | $4,757 | $25,082 | $6,302 | $18,780 |
| 2024 | $4,757 | $23,682 | $6,591 | $17,091 |
| 2023 | $4,490 | $22,356 | $5,713 | $16,643 |
| 2022 | $2,894 | $34,320 | $9,000 | $25,320 |
| 2021 | $3,122 | $32,040 | $9,000 | $23,040 |
| 2020 | $3,106 | $31,980 | $9,000 | $22,980 |
| 2019 | $4,128 | $27,360 | $9,000 | $18,360 |
| 2018 | $3,798 | $18,630 | $7,221 | $11,409 |
| 2017 | $3,584 | $17,584 | $8,091 | $9,493 |
| 2016 | $3,515 | $17,584 | $8,091 | $9,493 |
| 2015 | $1,781 | $17,418 | $7,007 | $10,411 |
| 2014 | $1,781 | $16,446 | $6,616 | $9,830 |
Source: Public Records
Map
Nearby Homes
- 20 W 18th Rd
- 21 W 18th Rd
- 21 Van Brunt Rd
- 14-7 Cross Bay Blvd
- 12 W 14th Rd
- 1317 Cross Bay Blvd
- 12-38 Cross Bay Blvd
- 1234 Cross Bay Blvd
- 12-34 Cross Bay Blvd
- 33 W 12th Rd
- 1024 Cross Bay Blvd
- 27 W 11th Rd
- 33 W 11th Rd
- 35 W 11th Rd
- 20 W 10th Rd
- 22 W 10th Rd
- 803 Cross Bay Blvd
- 815 Walton Rd
- 120 E 8th Rd
- 621 Cross Bay Blvd
- 12 W 18th Rd
- 14 W 18th Rd
- 1803 Cross Bay Blvd
- 1805 Cross Bay Blvd
- 1801 Cross Bay Blvd
- 16 W 18th Rd
- 1807 Cross Bay Blvd
- 18-20 W 18th Rd
- 18-28 W 18th Rd
- 18-22 W 18th Rd
- 18 W 18th Rd
- 18 W 18th Rd Unit 28
- 18 W 18th Rd Unit 22
- 18 W 18th Rd Unit 20
- 17-17 205 Ave
- 18 W 18th Rd Unit 5
- 18 W 18th Rd Unit 1
- 18 W 18th Rd
- 1717 Cross Bay Blvd
- 17-17 Cross Bay Blvd