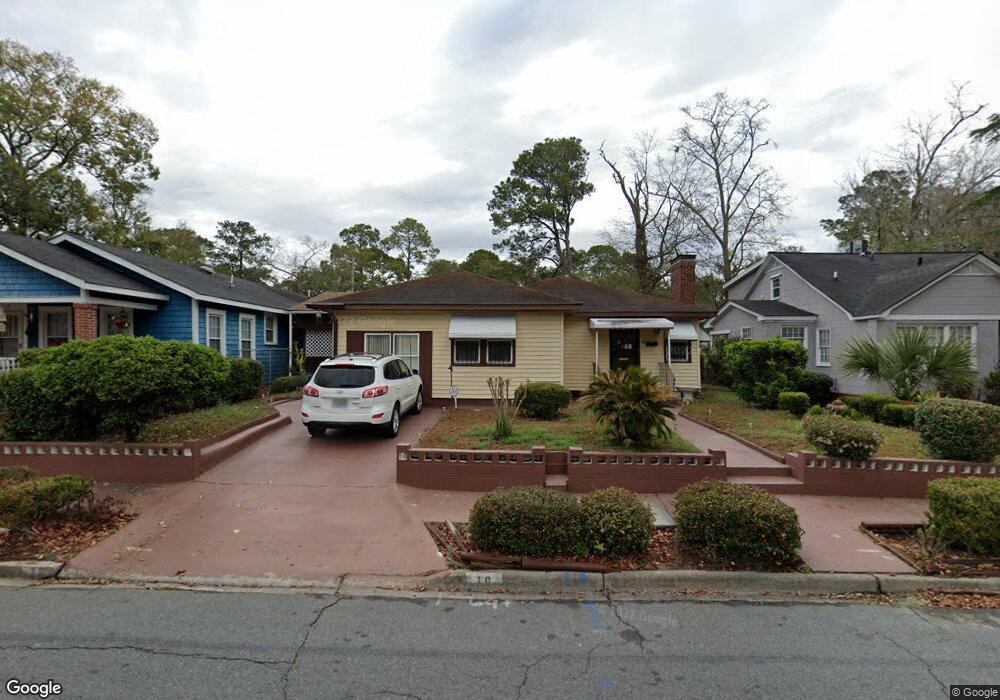
10 W 52nd St Savannah, GA 31405
Bingville NeighborhoodEstimated Value: $493,001 - $585,000
3
Beds
2
Baths
2,451
Sq Ft
$216/Sq Ft
Est. Value
About This Home
This home is located at 10 W 52nd St, Savannah, GA 31405 and is currently estimated at $528,750, approximately $215 per square foot. 10 W 52nd St is a home located in Chatham County with nearby schools including Derenne Middle School, Beach High School, and Susie King Taylor Community School Middle Grades Academy for Social Justice.
Ownership History
Date
Name
Owned For
Owner Type
Purchase Details
Closed on
Mar 28, 2013
Sold by
Lynah Henry
Bought by
Lynah Thelma Sharpe
Current Estimated Value
Home Financials for this Owner
Home Financials are based on the most recent Mortgage that was taken out on this home.
Original Mortgage
$118,000
Outstanding Balance
$83,480
Interest Rate
3.52%
Mortgage Type
New Conventional
Estimated Equity
$445,270
Purchase Details
Closed on
Mar 5, 2011
Sold by
Welch Henrietta Lynah
Bought by
Lynah Thelma
Create a Home Valuation Report for This Property
The Home Valuation Report is an in-depth analysis detailing your home's value as well as a comparison with similar homes in the area
Home Values in the Area
Average Home Value in this Area
Purchase History
| Date | Buyer | Sale Price | Title Company |
|---|---|---|---|
| Lynah Thelma Sharpe | -- | -- | |
| Lynah Thelma | $6,000 | -- | |
| Lynah Thelma | $6,000 | -- |
Source: Public Records
Mortgage History
| Date | Status | Borrower | Loan Amount |
|---|---|---|---|
| Open | Lynah Thelma Sharpe | $118,000 |
Source: Public Records
Tax History Compared to Growth
Tax History
| Year | Tax Paid | Tax Assessment Tax Assessment Total Assessment is a certain percentage of the fair market value that is determined by local assessors to be the total taxable value of land and additions on the property. | Land | Improvement |
|---|---|---|---|---|
| 2025 | $188 | $187,440 | $13,200 | $174,240 |
| 2024 | $188 | $205,920 | $10,560 | $195,360 |
| 2023 | $248 | $163,120 | $10,560 | $152,560 |
| 2022 | $248 | $95,520 | $6,400 | $89,120 |
| 2021 | $545 | $82,400 | $5,120 | $77,280 |
| 2020 | $310 | $71,560 | $2,720 | $68,840 |
| 2019 | $507 | $71,560 | $2,720 | $68,840 |
| 2018 | $294 | $58,920 | $2,720 | $56,200 |
| 2017 | $246 | $60,280 | $3,440 | $56,840 |
| 2016 | $231 | $59,640 | $3,440 | $56,200 |
| 2015 | $380 | $60,480 | $3,440 | $57,040 |
| 2014 | $463 | $61,440 | $0 | $0 |
Source: Public Records
Map
Nearby Homes