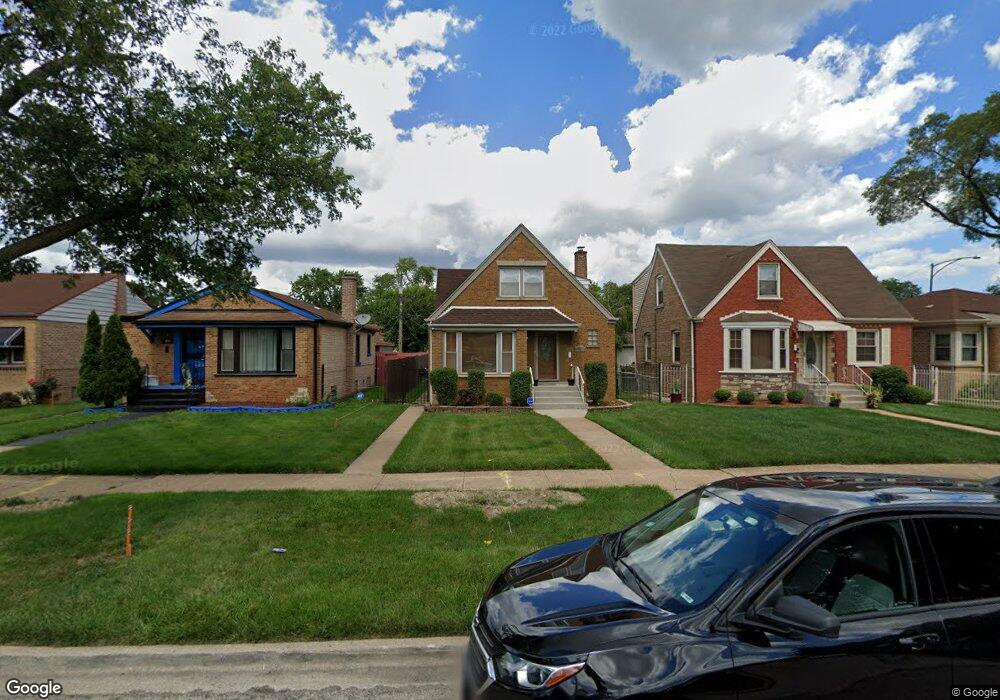
10 W Brayton St Chicago, IL 60628
West Pullman NeighborhoodEstimated Value: $186,000 - $263,000
4
Beds
3
Baths
1,527
Sq Ft
$144/Sq Ft
Est. Value
About This Home
This home is located at 10 W Brayton St, Chicago, IL 60628 and is currently estimated at $219,312, approximately $143 per square foot. 10 W Brayton St is a home located in Cook County with nearby schools including Gompers Elementary Fine Arts Opt School, Fenger Academy High School, and Chicago Collegiate Charter School.
Ownership History
Date
Name
Owned For
Owner Type
Purchase Details
Closed on
Jun 15, 2011
Sold by
James William
Bought by
Grier Tamara G
Current Estimated Value
Home Financials for this Owner
Home Financials are based on the most recent Mortgage that was taken out on this home.
Original Mortgage
$140,718
Outstanding Balance
$96,414
Interest Rate
4.5%
Mortgage Type
FHA
Estimated Equity
$122,898
Purchase Details
Closed on
Jan 30, 2009
Sold by
Fannie Mae
Bought by
James William
Purchase Details
Closed on
Jul 3, 2008
Sold by
Mason Janice
Bought by
Federal National Mortgage Association
Purchase Details
Closed on
Sep 30, 2005
Sold by
Pugh Donald
Bought by
Mason Janice
Home Financials for this Owner
Home Financials are based on the most recent Mortgage that was taken out on this home.
Original Mortgage
$139,000
Interest Rate
5.88%
Mortgage Type
Fannie Mae Freddie Mac
Create a Home Valuation Report for This Property
The Home Valuation Report is an in-depth analysis detailing your home's value as well as a comparison with similar homes in the area
Home Values in the Area
Average Home Value in this Area
Purchase History
| Date | Buyer | Sale Price | Title Company |
|---|---|---|---|
| Grier Tamara G | $145,000 | First American Title | |
| James William | $66,000 | First American Title | |
| Federal National Mortgage Association | -- | None Available | |
| Mason Janice | $140,000 | -- |
Source: Public Records
Mortgage History
| Date | Status | Borrower | Loan Amount |
|---|---|---|---|
| Open | Grier Tamara G | $140,718 | |
| Previous Owner | Mason Janice | $139,000 |
Source: Public Records
Tax History Compared to Growth
Tax History
| Year | Tax Paid | Tax Assessment Tax Assessment Total Assessment is a certain percentage of the fair market value that is determined by local assessors to be the total taxable value of land and additions on the property. | Land | Improvement |
|---|---|---|---|---|
| 2024 | $1,625 | $12,000 | $2,957 | $9,043 |
| 2023 | $1,564 | $11,000 | $2,464 | $8,536 |
| 2022 | $1,564 | $11,000 | $2,464 | $8,536 |
| 2021 | $1,547 | $11,000 | $2,464 | $8,536 |
| 2020 | $1,174 | $8,360 | $2,710 | $5,650 |
| 2019 | $1,160 | $9,187 | $2,710 | $6,477 |
| 2018 | $1,139 | $9,187 | $2,710 | $6,477 |
| 2017 | $1,941 | $12,371 | $2,464 | $9,907 |
| 2016 | $1,982 | $12,371 | $2,464 | $9,907 |
| 2015 | $1,791 | $12,371 | $2,464 | $9,907 |
| 2014 | $1,716 | $11,795 | $2,217 | $9,578 |
| 2013 | $1,671 | $11,795 | $2,217 | $9,578 |
Source: Public Records
Map
Nearby Homes
- 12511 S State St
- 15 E 126th St
- 12473 S Wabash Ave
- 61 W 125th St
- 12435 S Perry Ave
- 12446 S Perry Ave
- 12617 S Wentworth Ave
- 12438 S La Salle St
- 12336 S Lafayette Ave
- 12330 S Perry Ave
- 53 W 123rd St
- 12346 S Indiana Ave
- 12552 S Harvard Ave
- 12310 S Yale Ave
- 12211 S Lafayette Ave
- 12217 S La Salle St
- 12205 S State St
- 12251 S Yale Ave
- 12220 S La Salle St
- 12546 S Stewart Ave
- 14 W Brayton St
- 6 W Brayton St
- 2 W Brayton St
- 2 W Brayton St
- 18 W Brayton St
- 22 W Brayton St
- 2 E Brayton St
- 9 W 125th Place
- 5 W 125th Place
- 13 W 125th Place
- 26 W Brayton St
- 1 W 125th Place
- 17 W 125th Place
- 30 W Brayton St
- 9 W Brayton St
- 21 W 125th Place
- 13 W Brayton St
- 1 W Brayton St
- 21 W Brayton St