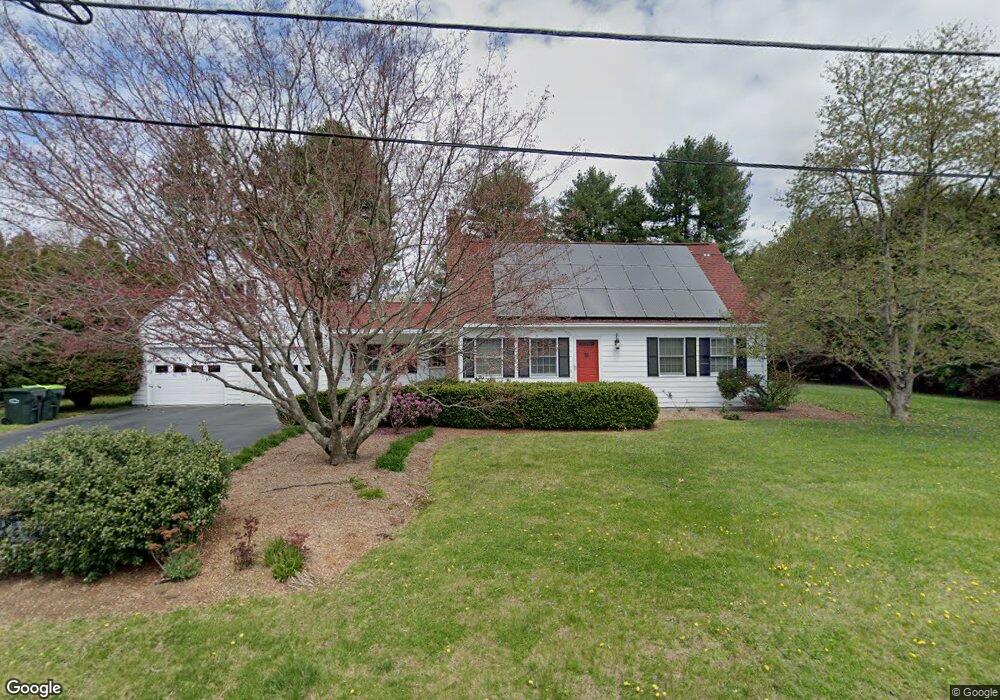
10 Wagonwheel Rd Sudbury, MA 01776
Estimated Value: $842,000 - $940,000
4
Beds
2
Baths
2,423
Sq Ft
$366/Sq Ft
Est. Value
About This Home
This home is located at 10 Wagonwheel Rd, Sudbury, MA 01776 and is currently estimated at $886,342, approximately $365 per square foot. 10 Wagonwheel Rd is a home located in Middlesex County with nearby schools including Israel Loring Elementary School, Ephraim Curtis Middle School, and Lincoln-Sudbury Regional High School.
Ownership History
Date
Name
Owned For
Owner Type
Purchase Details
Closed on
Oct 8, 2019
Sold by
Clemens Ali L
Bought by
Ali Clemens Ret
Current Estimated Value
Purchase Details
Closed on
Jul 1, 2003
Sold by
Robertson E L and Reyes-Robertson Sandra
Bought by
Clemens Ali Lai Lin Ho
Home Financials for this Owner
Home Financials are based on the most recent Mortgage that was taken out on this home.
Original Mortgage
$452,000
Interest Rate
5.53%
Mortgage Type
Purchase Money Mortgage
Purchase Details
Closed on
Oct 30, 1997
Sold by
Ouellette Armand E and Ouellette Bonnie B
Bought by
Robertson Ii Edward L and Reyes Sandra I
Home Financials for this Owner
Home Financials are based on the most recent Mortgage that was taken out on this home.
Original Mortgage
$295,000
Interest Rate
7.31%
Mortgage Type
Purchase Money Mortgage
Create a Home Valuation Report for This Property
The Home Valuation Report is an in-depth analysis detailing your home's value as well as a comparison with similar homes in the area
Home Values in the Area
Average Home Value in this Area
Purchase History
| Date | Buyer | Sale Price | Title Company |
|---|---|---|---|
| Ali Clemens Ret | -- | -- | |
| Clemens Ali Lai Lin Ho | $567,000 | -- | |
| Robertson Ii Edward L | $370,000 | -- |
Source: Public Records
Mortgage History
| Date | Status | Borrower | Loan Amount |
|---|---|---|---|
| Previous Owner | Clemens Ali Lai Lin Ho | $452,000 | |
| Previous Owner | Robertson Ii Edward L | $330,000 | |
| Previous Owner | Robertson Ii Edward L | $295,000 |
Source: Public Records
Tax History Compared to Growth
Tax History
| Year | Tax Paid | Tax Assessment Tax Assessment Total Assessment is a certain percentage of the fair market value that is determined by local assessors to be the total taxable value of land and additions on the property. | Land | Improvement |
|---|---|---|---|---|
| 2025 | $10,725 | $732,600 | $414,100 | $318,500 |
| 2024 | $10,342 | $707,900 | $402,000 | $305,900 |
| 2023 | $10,550 | $669,000 | $372,200 | $296,800 |
| 2022 | $10,267 | $568,800 | $341,600 | $227,200 |
| 2021 | $9,989 | $530,500 | $341,600 | $188,900 |
| 2020 | $9,788 | $530,500 | $341,600 | $188,900 |
| 2019 | $9,501 | $530,500 | $341,600 | $188,900 |
| 2018 | $9,700 | $541,000 | $364,300 | $176,700 |
| 2017 | $9,095 | $512,700 | $346,500 | $166,200 |
| 2016 | $8,768 | $492,600 | $333,300 | $159,300 |
| 2015 | $8,413 | $478,000 | $320,500 | $157,500 |
| 2014 | $8,388 | $465,200 | $311,100 | $154,100 |
Source: Public Records
Map
Nearby Homes
- 63 Landham Rd
- 0 Wagonwheel Rd
- 84 Hopestill Brown Rd
- 216 Landham Rd
- 8 Clara Rd
- 24 Pinewood Dr
- 14 Eisenhower Rd
- 14 Francine Rd
- 23 Massasoit Ave
- 81 Nicholas Rd Unit B
- 71 Nicholas Rd Unit H
- 19 Park Ave
- 91 Eaton Rd W
- 36 Concord Rd
- 29 Derby St
- 94 Goodmans Hill Rd
- 6 Old County Rd Unit 16
- 163 Water St
- 1011 Boston Post Rd
- 19 Nob Hill Dr