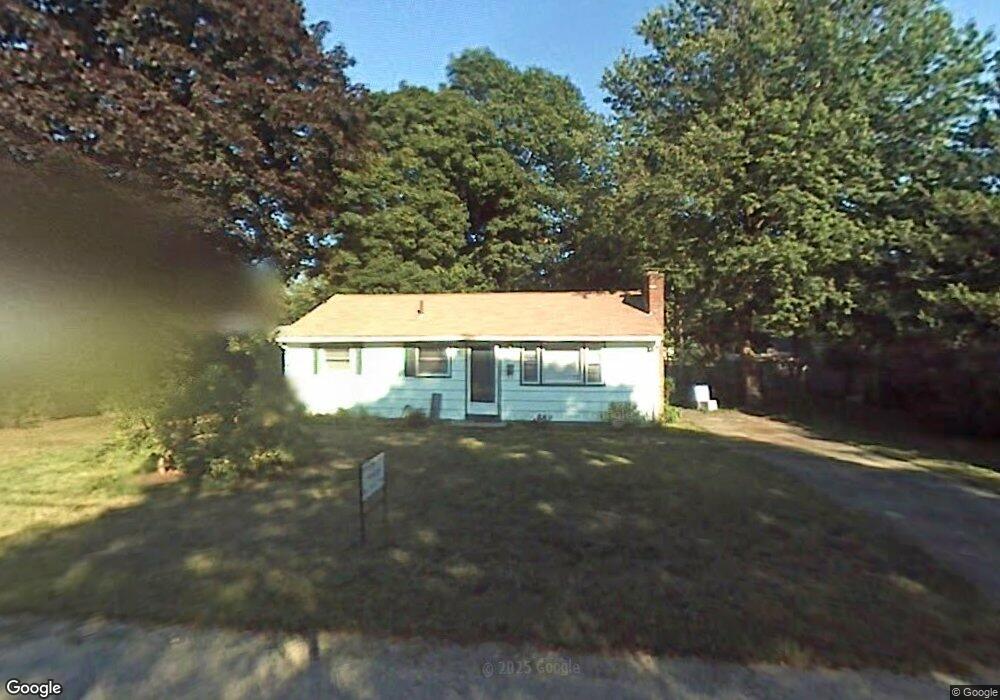
10 Walsh Rd Unit 1 Bedford, MA 01730
Estimated Value: $701,000 - $894,631
3
Beds
1
Bath
1,200
Sq Ft
$675/Sq Ft
Est. Value
About This Home
This home is located at 10 Walsh Rd Unit 1, Bedford, MA 01730 and is currently estimated at $809,908, approximately $674 per square foot. 10 Walsh Rd Unit 1 is a home located in Middlesex County with nearby schools including Lt. Elezer Davis Elementary School, Lt .Job Lane Elementary School, and John Glenn Middle School.
Ownership History
Date
Name
Owned For
Owner Type
Purchase Details
Closed on
Jul 1, 2010
Sold by
Chen Frank Hongguang
Bought by
Mcelhiney Michael and Hopkins Michelle
Current Estimated Value
Purchase Details
Closed on
Feb 29, 2000
Sold by
Branton Louis A and Dolan Branton Lisa
Bought by
Chen Hongguang and Zhang Xiofan
Purchase Details
Closed on
Sep 30, 1997
Sold by
Rosenberry Richard and Banks Candace L
Bought by
Branton Louis A and Dolan-Branton Lisa
Purchase Details
Closed on
Jan 17, 1995
Sold by
Chute Jonathan F and Chute Beth A
Bought by
Rosenberry Richard and Banks Candace L
Purchase Details
Closed on
Mar 29, 1991
Sold by
Akimchuk James W and Akimchuk Charlene
Bought by
Chute Jonathan F and Loring Beth A
Create a Home Valuation Report for This Property
The Home Valuation Report is an in-depth analysis detailing your home's value as well as a comparison with similar homes in the area
Home Values in the Area
Average Home Value in this Area
Purchase History
We collect this data history from publicly available records. To have your information removed, we recommend requesting removal directly through your county’s website.
| Date | Buyer | Sale Price | Title Company |
|---|---|---|---|
| Mcelhiney Michael | $250,000 | -- | |
| Chen Hongguang | $200,000 | -- | |
| Branton Louis A | $179,900 | -- | |
| Rosenberry Richard | $151,000 | -- | |
| Chute Jonathan F | $133,500 | -- |
Source: Public Records
Mortgage History
We collect this data history from publicly available records. To have your information removed, we recommend requesting removal directly through your county’s website.
| Date | Status | Borrower | Loan Amount |
|---|---|---|---|
| Open | Chute Jonathan F | $32,000 | |
| Open | Chute Jonathan F | $189,000 |
Source: Public Records
Tax History
| Year | Tax Paid | Tax Assessment Tax Assessment Total Assessment is a certain percentage of the fair market value that is determined by local assessors to be the total taxable value of land and additions on the property. | Land | Improvement |
|---|---|---|---|---|
| 2025 | $82 | $680,200 | $443,500 | $236,700 |
| 2024 | $7,695 | $647,700 | $422,300 | $225,400 |
| 2023 | $7,675 | $615,000 | $398,900 | $216,100 |
| 2022 | $7,800 | $574,400 | $383,200 | $191,200 |
| 2021 | $9,756 | $566,600 | $375,400 | $191,200 |
| 2020 | $5,971 | $582,300 | $391,100 | $191,200 |
| 2019 | $5,449 | $579,500 | $391,100 | $188,400 |
| 2018 | $8,752 | $516,600 | $335,100 | $181,500 |
| 2017 | $7,467 | $504,200 | $326,900 | $177,300 |
| 2016 | $5,767 | $377,411 | $297,200 | $80,211 |
| 2015 | $5,518 | $377,411 | $297,200 | $80,211 |
| 2014 | $5,685 | $361,900 | $281,600 | $80,300 |
Source: Public Records
Map
Nearby Homes
- 16 Walsh Rd
- 6 Lane Ave
- 253 Great Rd
- 36 Loomis St Unit 102
- 36 Loomis St Unit 301
- 36 Loomis St Unit 104
- 81-83 South Rd
- 112 Page Rd
- 70 Great Rd Unit G
- 21 Fletcher Rd
- 289 South Rd
- 75 Page Rd Unit 16
- 75 Page Rd Unit 20
- 35 Neillian Way Unit 35A
- 5 Great Rd
- 72 Hancock St
- 24 Pine Knoll Rd
- 75 Westview St
- 4 Abbott Ln
- 1 Cushing St
Your Personal Tour Guide
Ask me questions while you tour the home.