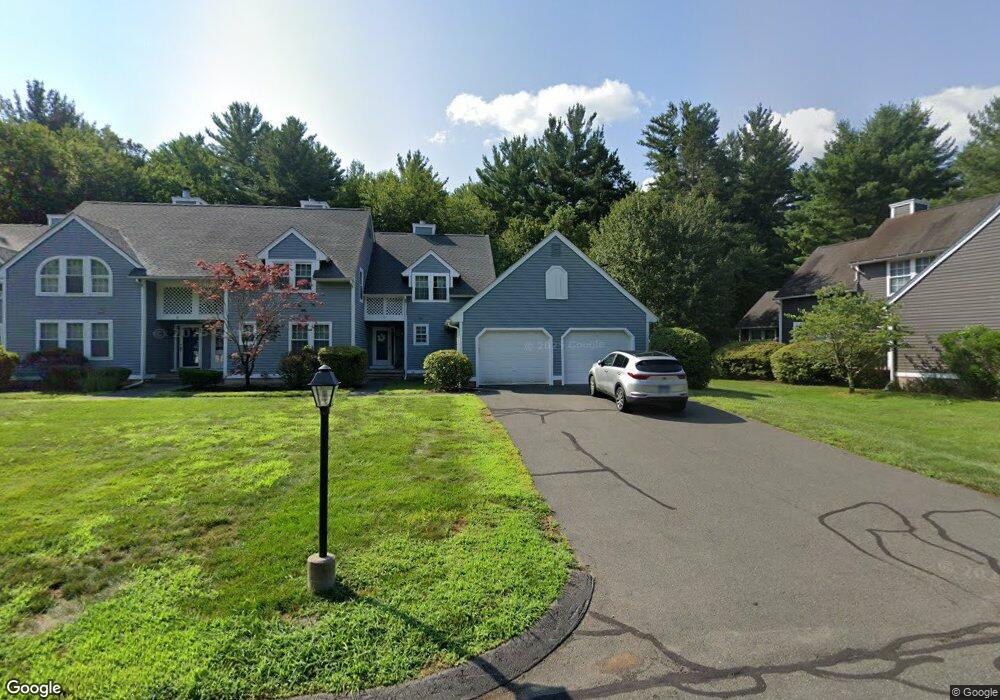
10 Whytewood Ln Granby, CT 06035
Estimated Value: $230,000 - $288,000
2
Beds
2
Baths
1,139
Sq Ft
$230/Sq Ft
Est. Value
About This Home
This home is located at 10 Whytewood Ln, Granby, CT 06035 and is currently estimated at $262,173, approximately $230 per square foot. 10 Whytewood Ln is a home located in Hartford County with nearby schools including Kelly Lane Primary School, Granby Memorial Middle School, and Granby Memorial High School.
Ownership History
Date
Name
Owned For
Owner Type
Purchase Details
Closed on
Aug 9, 2011
Sold by
Weichert Relocation Re
Bought by
Dirienzo Rachel
Current Estimated Value
Home Financials for this Owner
Home Financials are based on the most recent Mortgage that was taken out on this home.
Original Mortgage
$145,800
Outstanding Balance
$100,667
Interest Rate
4.51%
Estimated Equity
$161,506
Purchase Details
Closed on
Feb 27, 2007
Sold by
Yost Beth
Bought by
Hobbs Benjamin
Purchase Details
Closed on
Aug 26, 2004
Sold by
Mccullough Michael and Mccullough Amanda
Bought by
Yost Beth
Purchase Details
Closed on
Sep 13, 2000
Sold by
Rubin Stacey
Bought by
Mccullough Michael and Mccullough Amanda
Purchase Details
Closed on
Jul 15, 1997
Sold by
Collins Stephen and Collins Vivian
Bought by
Rubin Stacey
Create a Home Valuation Report for This Property
The Home Valuation Report is an in-depth analysis detailing your home's value as well as a comparison with similar homes in the area
Home Values in the Area
Average Home Value in this Area
Purchase History
| Date | Buyer | Sale Price | Title Company |
|---|---|---|---|
| Dirienzo Rachel | $162,000 | -- | |
| Weichert Relocation Re | $162,000 | -- | |
| Dirienzo Rachel V | $162,000 | -- | |
| Hobbs Benjamin | $192,500 | -- | |
| Hobbs Benjamin | $192,500 | -- | |
| Yost Beth | $169,000 | -- | |
| Yost Beth | $169,000 | -- | |
| Mccullough Michael | $120,000 | -- | |
| Mccullough Michael | $120,000 | -- | |
| Rubin Stacey | $92,000 | -- | |
| Rubin Stacey | $92,000 | -- |
Source: Public Records
Mortgage History
| Date | Status | Borrower | Loan Amount |
|---|---|---|---|
| Open | Rubin Stacey | $145,800 | |
| Closed | Rubin Stacey | $145,800 |
Source: Public Records
Tax History Compared to Growth
Tax History
| Year | Tax Paid | Tax Assessment Tax Assessment Total Assessment is a certain percentage of the fair market value that is determined by local assessors to be the total taxable value of land and additions on the property. | Land | Improvement |
|---|---|---|---|---|
| 2025 | $4,672 | $136,570 | $0 | $136,570 |
| 2024 | $4,525 | $136,570 | $0 | $136,570 |
| 2023 | $4,355 | $136,570 | $0 | $136,570 |
| 2022 | $4,061 | $101,570 | $0 | $101,570 |
| 2021 | $4,023 | $101,570 | $0 | $101,570 |
| 2020 | $4,023 | $101,570 | $0 | $101,570 |
| 2019 | $4,023 | $101,570 | $0 | $101,570 |
| 2018 | $3,930 | $101,570 | $0 | $101,570 |
| 2017 | $4,045 | $106,610 | $0 | $106,610 |
| 2016 | $3,938 | $106,610 | $0 | $106,610 |
| 2015 | $3,861 | $106,610 | $0 | $106,610 |
| 2014 | $3,787 | $106,610 | $0 | $106,610 |
Source: Public Records
Map
Nearby Homes
- 47 Salmon Brook St
- 238 Salmon Brook St
- 5 Washington Dr
- 24 Rushford Meade Unit 24
- 106 W Granby Rd
- 17 Elizabeth St
- 14 Brettonwood Dr
- 52 North Rd
- 14 Gordon St
- 4 Stonewall Dr
- 7R Stonewall Dr
- 125 N Granby Rd
- 2 Quail Dr Unit 2
- 14 Teal Cir Unit 14
- 11 Mallard Cir
- 68 Cambridge Ct
- 22 Old Hartford Ave Unit 22
- 62 Cambridge Ct
- 2 North Dr
- 69 Cambridge Ct
- 10 Whytewood Ln Unit 10
- 8 Whytewood Ln
- 8 Whytewood Ln Unit 8
- 6 Whytewood Ln
- 4 Whytewood Ln
- 12 Whytewood Ln
- 2 Whytewood Ln
- 3 Whytewood Ln
- 14 Whytewood Ln
- 5 Whytewood Ln
- 7 Whytewood Ln
- 1 Whytewood Ln
- 1 Whytewood Ln Unit 1
- 9 Whytewood Ln
- 9 Whytewood Ln Unit 9
- 11 Whytewood Ln
- 13 Whytewood Ln
- 13 Whytewood Ln Unit 13
- 1 Windcrest Dr
- 15 Chatsworth Rd