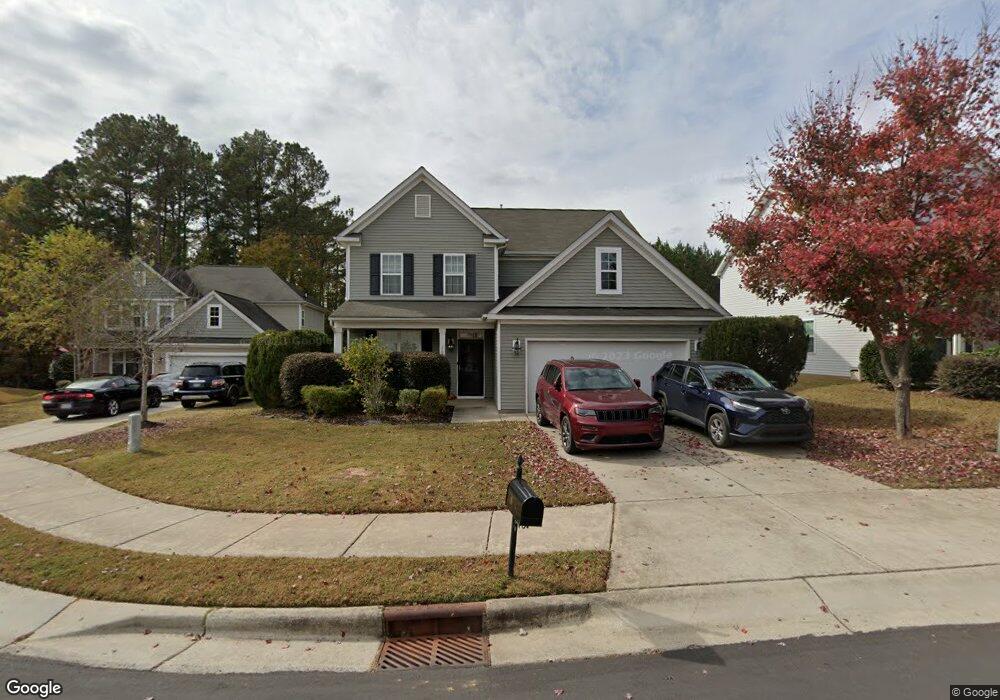
10 Wild Sage Way Durham, NC 27703
Eastern Durham NeighborhoodEstimated Value: $457,000 - $490,000
4
Beds
3
Baths
2,568
Sq Ft
$185/Sq Ft
Est. Value
About This Home
This home is located at 10 Wild Sage Way, Durham, NC 27703 and is currently estimated at $476,175, approximately $185 per square foot. 10 Wild Sage Way is a home located in Durham County with nearby schools including Spring Valley Elementary School, John W Neal Middle School, and Southern School of Energy & Sustainability.
Ownership History
Date
Name
Owned For
Owner Type
Purchase Details
Closed on
Nov 6, 2020
Sold by
Fowler Randy A
Bought by
Fowler Eandy A and Fowler Ashlee N
Current Estimated Value
Home Financials for this Owner
Home Financials are based on the most recent Mortgage that was taken out on this home.
Original Mortgage
$256,500
Outstanding Balance
$228,249
Interest Rate
2.8%
Mortgage Type
VA
Estimated Equity
$247,926
Purchase Details
Closed on
Jan 15, 2015
Sold by
Emerson Kristin A and Emerson Casey J
Bought by
Blackburn Pamela
Home Financials for this Owner
Home Financials are based on the most recent Mortgage that was taken out on this home.
Original Mortgage
$216,727
Interest Rate
3.62%
Mortgage Type
FHA
Purchase Details
Closed on
Aug 24, 2011
Sold by
Lennar Carolinas Llc
Bought by
Emerson Kristin A and Emerson Casey J
Home Financials for this Owner
Home Financials are based on the most recent Mortgage that was taken out on this home.
Original Mortgage
$188,741
Interest Rate
4.5%
Mortgage Type
FHA
Create a Home Valuation Report for This Property
The Home Valuation Report is an in-depth analysis detailing your home's value as well as a comparison with similar homes in the area
Home Values in the Area
Average Home Value in this Area
Purchase History
| Date | Buyer | Sale Price | Title Company |
|---|---|---|---|
| Fowler Eandy A | -- | None Available | |
| Blackburn Pamela | $225,000 | None Available | |
| Emerson Kristin A | $194,000 | None Available |
Source: Public Records
Mortgage History
| Date | Status | Borrower | Loan Amount |
|---|---|---|---|
| Open | Fowler Eandy A | $256,500 | |
| Closed | Blackburn Pamela | $216,727 | |
| Previous Owner | Emerson Kristin A | $188,741 |
Source: Public Records
Tax History Compared to Growth
Tax History
| Year | Tax Paid | Tax Assessment Tax Assessment Total Assessment is a certain percentage of the fair market value that is determined by local assessors to be the total taxable value of land and additions on the property. | Land | Improvement |
|---|---|---|---|---|
| 2025 | $4,867 | $490,989 | $105,000 | $385,989 |
| 2024 | $3,691 | $264,603 | $47,880 | $216,723 |
| 2023 | $3,466 | $264,603 | $47,880 | $216,723 |
| 2022 | $3,387 | $264,603 | $47,880 | $216,723 |
| 2021 | $3,371 | $264,603 | $47,880 | $216,723 |
| 2020 | $3,291 | $264,603 | $47,880 | $216,723 |
| 2019 | $3,291 | $264,603 | $47,880 | $216,723 |
| 2018 | $3,081 | $227,096 | $35,910 | $191,186 |
| 2017 | $3,058 | $227,096 | $35,910 | $191,186 |
| 2016 | $2,955 | $227,096 | $35,910 | $191,186 |
| 2015 | $3,062 | $221,215 | $37,030 | $184,185 |
| 2014 | $3,062 | $221,215 | $37,030 | $184,185 |
Source: Public Records
Map
Nearby Homes
- 427 Cottonseed Way
- 303 Holly Blossom Dr
- 121 English Ivy Dr
- 316 Vintage Holly Dr
- 316 Wellwater Ave
- 626 Ashburn Ln
- 621 Wellwater Ave
- 619 Ashburn Ln
- 309 Rondelay Dr
- 1417 Underbrush Dr
- 613 Ashburn Ln
- 634 Conover Rd
- 2 Red Sage Ct
- 617 Hiddenbrook Dr
- 633 Conover Rd
- 641 Conover Rd Unit B
- 631 Conover Rd
- 1110 W Wellwater Ave
- 629 Conover Rd
- 124 Green Gables Way
- 8 Wild Sage Way
- 8 Wild Sage Way Unit 27
- 12 Wild Sage Way
- 6 Wild Sage Way
- 14 Wild Sage Way
- 2 White Willow Ct
- 11 Wild Sage Way
- 1 White Willow Ct
- 9 Wild Sage Way
- 4 White Willow Ct
- 3 White Willow Ct
- 201 Holly Blossom Dr
- 203 Holly Blossom Dr
- 205 Holly Blossom Dr
- 6 White Willow Ct
- 5 White Willow Ct
- 413 Cottonseed Way
- 107 Holly Blossom Dr
- 415 Cottonseed Way Unit RS39
- 415 Cottonseed Way