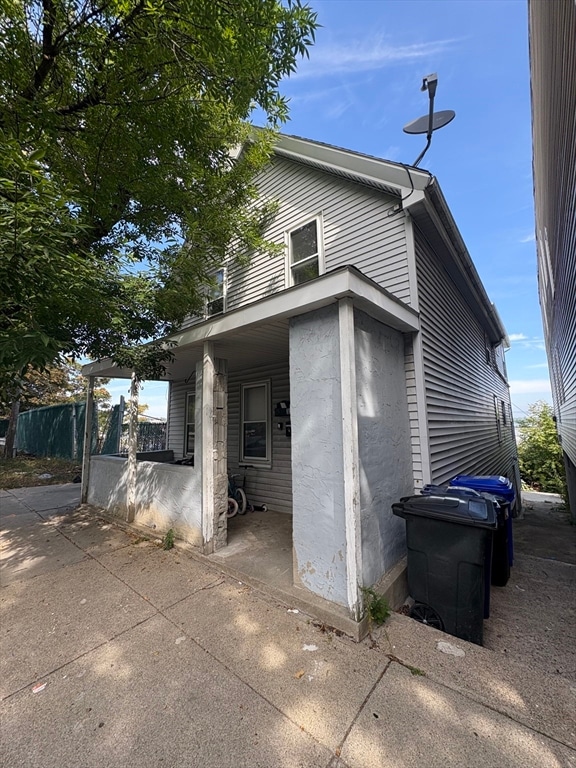
10 Wordsworth St Boston, MA 02128
Harbor View-Orient Heights NeighborhoodEstimated payment $4,565/month
Highlights
- Beach Front
- Corner Lot
- Heating System Uses Natural Gas
- Wood Flooring
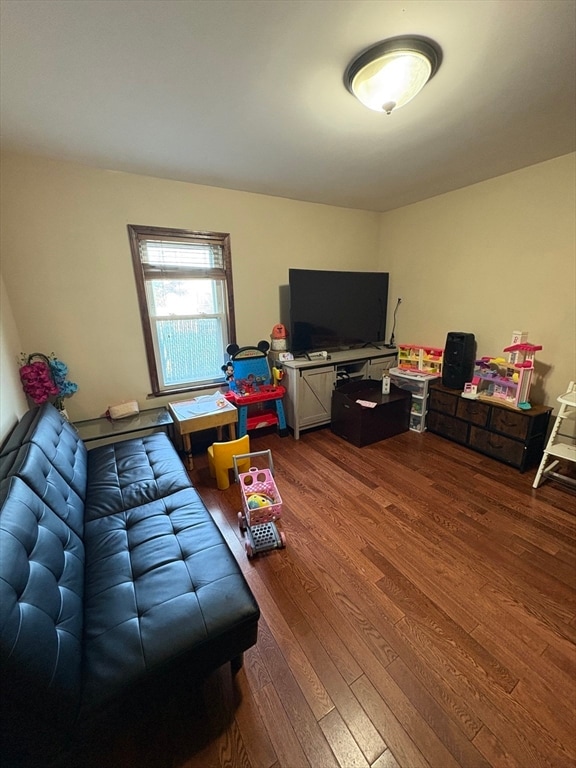
- Living Room
- 5-minute walk to Cuneo Park
About This Home
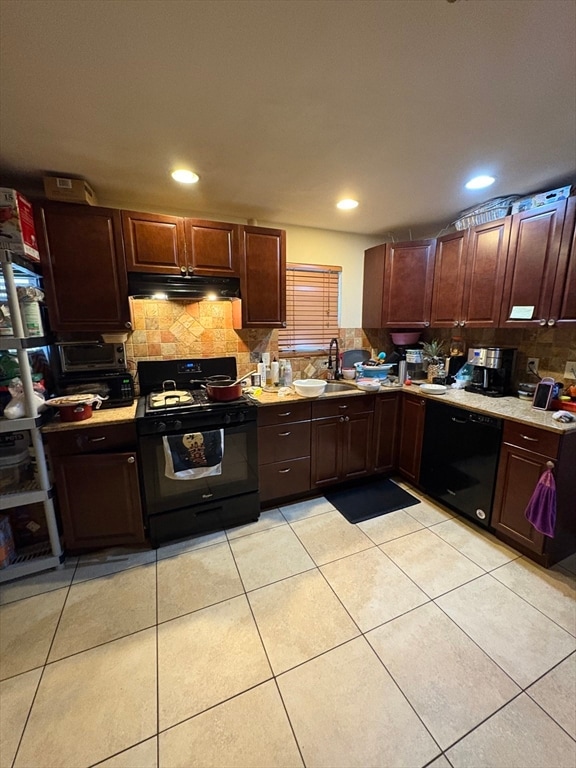
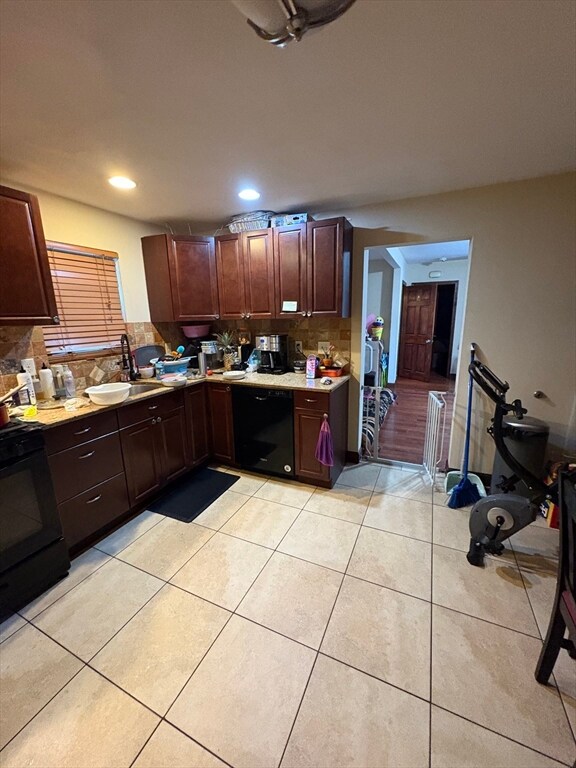
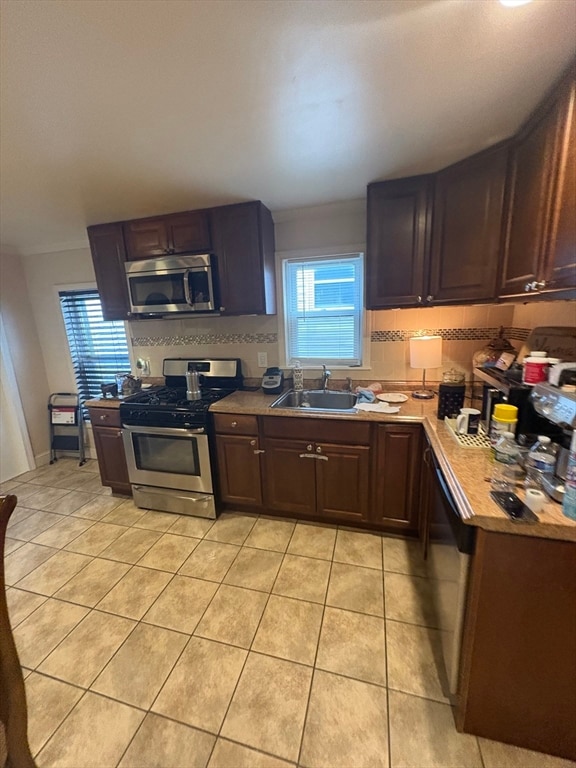
Welcome to 10 Wordsworth St, a fully updated 2-family just minutes from Orient Heights Station**Unit 2 to be delivered vacant at closing, making this a perfect buy for owner occupants!**Utilities are separately metered, and there is convenient common laundry for tenants.Major systems have all been modernized within the last 3 years, including the roof, heating systems, water heaters, and electric panels, offering true peace of mind and minimal maintenance for years to come.Situated on a corner lot, this property provides strong current cash flow with passive-income stability and future development potential in one of East Boston’s most desirable transit-accessible neighborhoods.Turnkey, stable, and well-located—perfect for investors or owner-occupants looking to secure a high-performing asset.
Property Details
Home Type
- Multi-Family
Est. Annual Taxes
- $6,736
Year Built
- Built in 1899
Lot Details
- 2,500 Sq Ft Lot
- Beach Front
- Corner Lot
Home Design
- Concrete Perimeter Foundation
Interior Spaces
- 1,816 Sq Ft Home
- Property has 1 Level
- Insulated Windows
- Insulated Doors
- Living Room
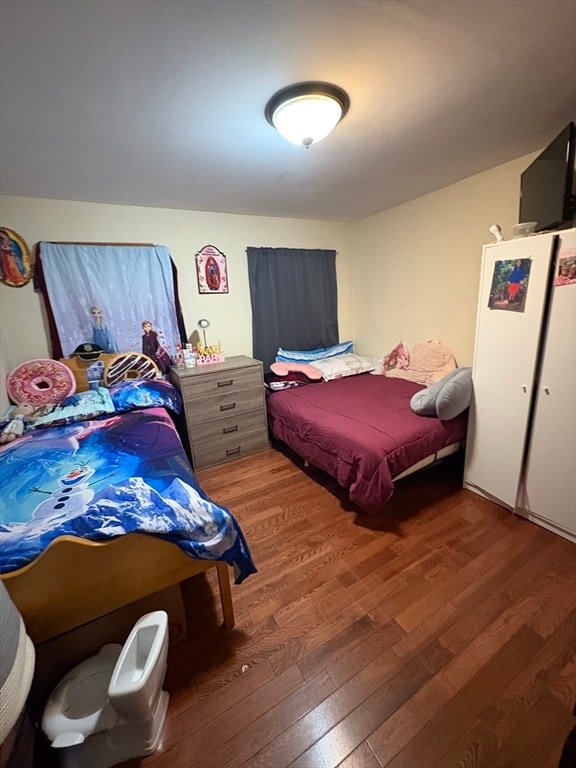
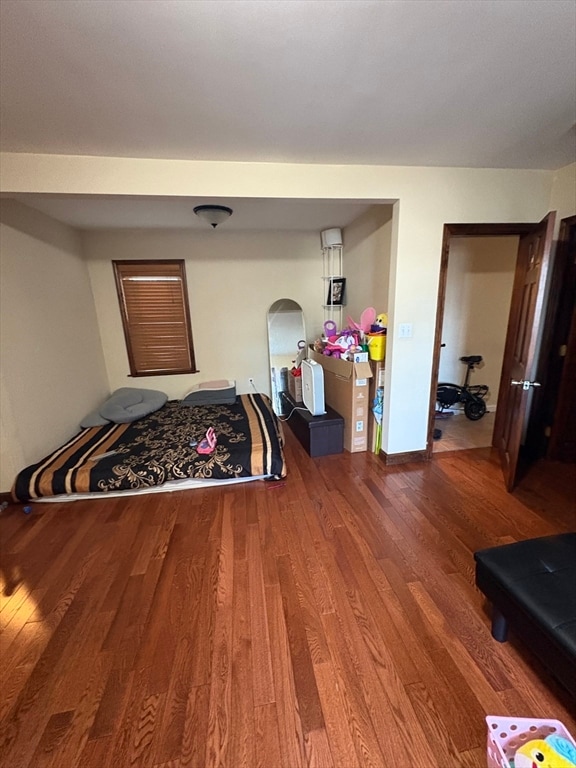
- Wood Flooring
- Basement Fills Entire Space Under The House
- Gas Dryer Hookup
Bedrooms and Bathrooms
- 4 Bedrooms
- 2 Full Bathrooms
Utilities
- 2 Heating Zones
- Heating System Uses Natural Gas
Listing and Financial Details
- Rent includes unit 1(water), unit 2(water)
- Assessor Parcel Number 1330890
Community Details
Overview
- 2 Units
Building Details
- Insurance Expense $2,395
- Water Sewer Expense $2,400
- Operating Expense $4,795
- Net Operating Income $48,469
Map
Home Values in the Area
Average Home Value in this Area
Tax History
| Year | Tax Paid | Tax Assessment Tax Assessment Total Assessment is a certain percentage of the fair market value that is determined by local assessors to be the total taxable value of land and additions on the property. | Land | Improvement |
|---|---|---|---|---|
| 2025 | $6,736 | $581,700 | $220,600 | $361,100 |
| 2024 | $6,191 | $568,000 | $199,200 | $368,800 |
| 2023 | $5,810 | $541,000 | $189,700 | $351,300 |
| 2022 | $5,499 | $505,400 | $177,200 | $328,200 |
| 2021 | $5,137 | $481,400 | $168,800 | $312,600 |
| 2020 | $4,955 | $469,200 | $164,100 | $305,100 |
| 2019 | $4,496 | $426,600 | $112,100 | $314,500 |
| 2018 | $4,064 | $387,800 | $112,100 | $275,700 |
| 2017 | $3,733 | $352,500 | $112,100 | $240,400 |
| 2016 | $3,526 | $320,500 | $112,100 | $208,400 |
| 2015 | $3,456 | $285,400 | $96,400 | $189,000 |
| 2014 | $3,146 | $250,100 | $96,400 | $153,700 |
Property History
| Date | Event | Price | List to Sale | Price per Sq Ft |
|---|---|---|---|---|
| 03/30/2026 03/30/26 | Price Changed | $750,000 | -6.1% | $413 / Sq Ft |
| 02/24/2026 02/24/26 | For Sale | $799,000 | 0.0% | $440 / Sq Ft |
| 12/15/2025 12/15/25 | Off Market | $799,000 | -- | -- |
| 12/09/2025 12/09/25 | Price Changed | $799,000 | -6.0% | $440 / Sq Ft |
| 11/20/2025 11/20/25 | For Sale | $850,000 | -- | $468 / Sq Ft |
Purchase History
| Date | Type | Sale Price | Title Company |
|---|---|---|---|
| Deed | -- | -- |
Mortgage History
| Date | Status | Loan Amount | Loan Type |
|---|---|---|---|
| Open | $90,000 | Purchase Money Mortgage |
Source: MLS Property Information Network (MLS PIN)
MLS Number: 73456705
APN: EBOS-000000-000001-000591
Disclaimer: Certain information contained herein is derived from information provided by parties other than Homes.com. All information provided is deemed reliable, but is not guaranteed to be accurate and should be independently verified.
![]() The property listing data and information, or the Images, set forth herein were provided to MLS Property Information Network, Inc. from third party sources, including sellers, lessors and public records, and were compiled by MLS Property Information Network, Inc. The property listing data and information, and the Images, are for the personal, non-commercial use of consumers having a good faith interest in purchasing or leasing listed properties of the type displayed to them and may not be used for any purpose other than to identify prospective properties which such consumers may have a good faith interest in purchasing or leasing. MLS Property Information Network, Inc. and its subscribers disclaim any and all representations and warranties as to the accuracy of the property listing data and information, or as to the accuracy of any of the Images, set forth herein.
The property listing data and information, or the Images, set forth herein were provided to MLS Property Information Network, Inc. from third party sources, including sellers, lessors and public records, and were compiled by MLS Property Information Network, Inc. The property listing data and information, and the Images, are for the personal, non-commercial use of consumers having a good faith interest in purchasing or leasing listed properties of the type displayed to them and may not be used for any purpose other than to identify prospective properties which such consumers may have a good faith interest in purchasing or leasing. MLS Property Information Network, Inc. and its subscribers disclaim any and all representations and warranties as to the accuracy of the property listing data and information, or as to the accuracy of any of the Images, set forth herein.
- 58 Byron St Unit 3
- 43 Wordsworth St Unit 2
- 95 Addison St Unit PH8
- 95 Addison St Unit 102
- 95 Addison St Unit PH10
- 125 Addison St Unit 206
- 656 Saratoga St Unit 207
- 656 Saratoga St Unit 313
- 656 Saratoga St Unit 211
- 512 Bennington St
- 661 Bennington St Unit 3
- 839 Saratoga St Unit 3
- 198 Byron St
- 130 Coleridge St Unit 6
- 130 Coleridge St Unit 1
- 136 Coleridge St
- 873 Saratoga St
- 181 Cowper St Unit 302
- 443 Bennington & 430 Frankfort St
- 176 Coleridge St
- 30 Wordsworth St Unit 2
- 48 Wordsworth St Unit 1
- 43 Wordsworth St Unit 1
- 117 Addison St Unit 1
- 125 Addison St Unit 1
- 756 Saratoga St Unit 1
- 18 Curtis St
- 18 Curtis St
- 630 Bennington St Unit 3
- 528 Bennington St Unit 2
- 144 Addison St
- 833 Saratoga St Unit 415S
- 661 Bennington St Unit 3
- 519 Bennington St
- 678 Bennington St Unit 1
- 678 Bennington St Unit 2
- 17 Horace St Unit 2
- 88 Brandywyne Dr
- 103-105 Homer St Unit 1
- 113 Moore St Unit 2

Ask me questions while you tour the home.