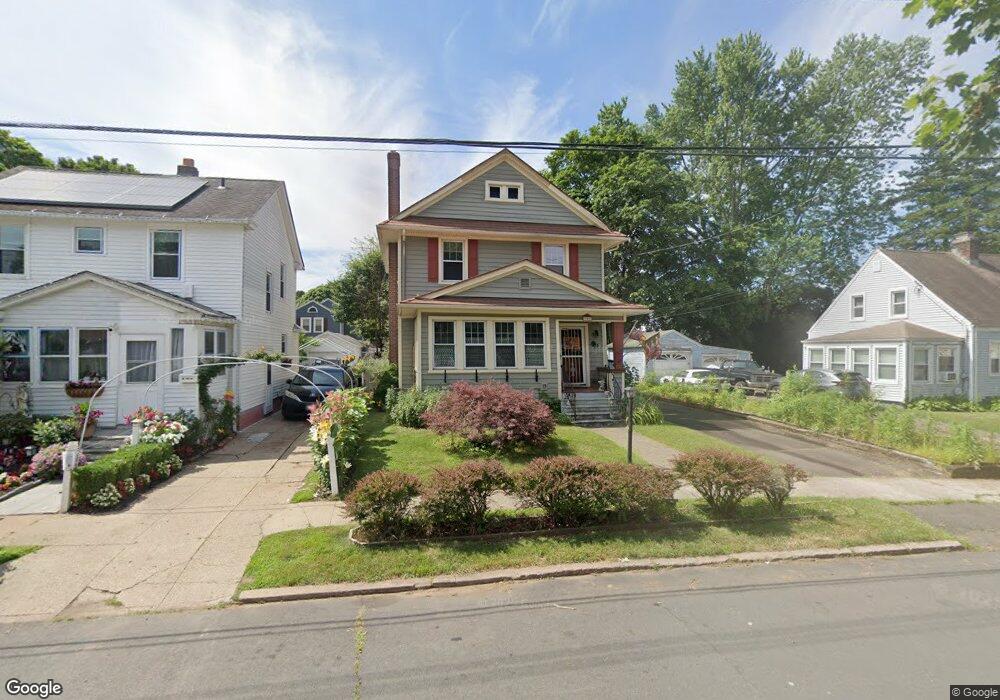
100 4th St Hamden, CT 06514
Estimated Value: $316,801 - $352,000
3
Beds
2
Baths
1,626
Sq Ft
$205/Sq Ft
Est. Value
About This Home
This home is located at 100 4th St, Hamden, CT 06514 and is currently estimated at $332,700, approximately $204 per square foot. 100 4th St is a home located in New Haven County with nearby schools including Hamden Middle School, Hamden High School, and Salma K. Farid Academy.
Ownership History
Date
Name
Owned For
Owner Type
Purchase Details
Closed on
Jan 24, 2013
Sold by
Demers Nancy
Bought by
Kiernan Christopher
Current Estimated Value
Purchase Details
Closed on
Apr 29, 1997
Sold by
Kahn Afzal A and Florentine Richard T
Bought by
Williams Nancy L
Purchase Details
Closed on
Jul 31, 1996
Sold by
Tiernan Robert
Bought by
Khan Afzal A
Create a Home Valuation Report for This Property
The Home Valuation Report is an in-depth analysis detailing your home's value as well as a comparison with similar homes in the area
Home Values in the Area
Average Home Value in this Area
Purchase History
| Date | Buyer | Sale Price | Title Company |
|---|---|---|---|
| Kiernan Christopher | -- | -- | |
| Williams Nancy L | $85,000 | -- | |
| Khan Afzal A | $88,500 | -- |
Source: Public Records
Mortgage History
| Date | Status | Borrower | Loan Amount |
|---|---|---|---|
| Open | Khan Afzal A | $153,184 | |
| Previous Owner | Khan Afzal A | $199,837 | |
| Previous Owner | Khan Afzal A | $50,000 |
Source: Public Records
Tax History
| Year | Tax Paid | Tax Assessment Tax Assessment Total Assessment is a certain percentage of the fair market value that is determined by local assessors to be the total taxable value of land and additions on the property. | Land | Improvement |
|---|---|---|---|---|
| 2025 | $10,768 | $207,550 | $40,320 | $167,230 |
| 2024 | $7,338 | $131,950 | $25,690 | $106,260 |
| 2023 | $7,660 | $135,870 | $25,690 | $110,180 |
| 2022 | $7,538 | $135,870 | $25,690 | $110,180 |
| 2021 | $7,125 | $135,870 | $25,690 | $110,180 |
| 2020 | $6,116 | $117,670 | $28,560 | $89,110 |
| 2019 | $5,749 | $117,670 | $28,560 | $89,110 |
| 2018 | $5,643 | $117,670 | $28,560 | $89,110 |
| 2017 | $5,326 | $117,670 | $28,560 | $89,110 |
| 2016 | $5,338 | $117,670 | $28,560 | $89,110 |
| 2015 | $5,602 | $137,060 | $44,940 | $92,120 |
| 2014 | $5,473 | $137,060 | $44,940 | $92,120 |
Source: Public Records
Map
Nearby Homes
Your Personal Tour Guide
Ask me questions while you tour the home.