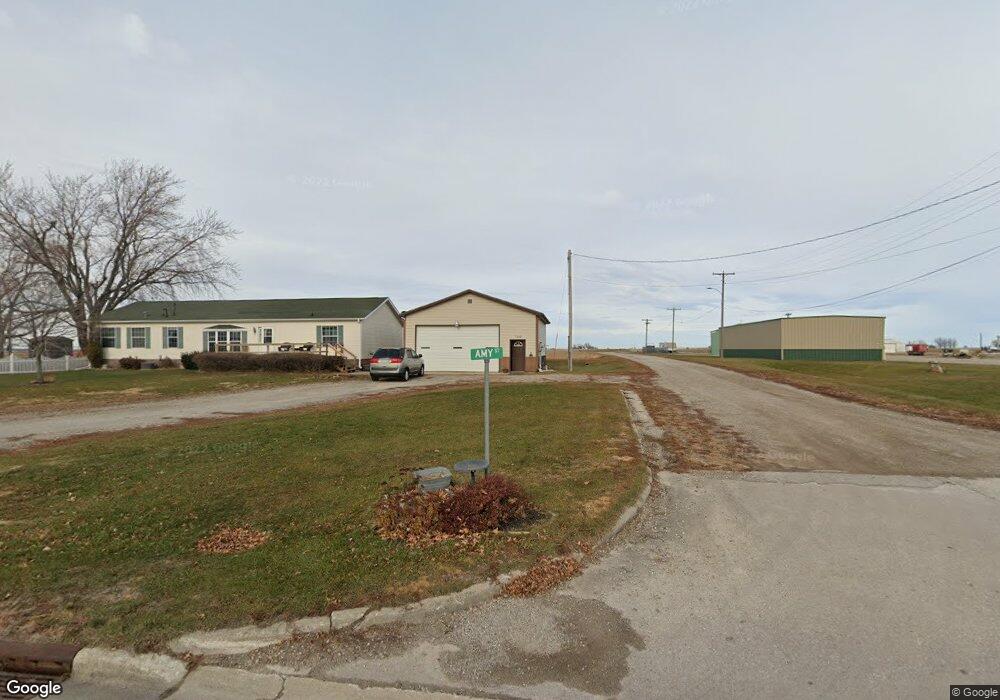
100 Amy St Baxter, IA 50028
Estimated Value: $228,000 - $306,000
3
Beds
2
Baths
1,911
Sq Ft
$138/Sq Ft
Est. Value
About This Home
This home is located at 100 Amy St, Baxter, IA 50028 and is currently estimated at $264,660, approximately $138 per square foot. 100 Amy St is a home with nearby schools including Baxter Elementary School and Baxter High School.
Ownership History
Date
Name
Owned For
Owner Type
Purchase Details
Closed on
Mar 3, 2014
Sold by
Olson Peggy
Bought by
Olson Carroll
Current Estimated Value
Purchase Details
Closed on
Jul 26, 2005
Sold by
Salem Enterprises Ltd
Bought by
Olson Carroll E and Olson Peggy D
Home Financials for this Owner
Home Financials are based on the most recent Mortgage that was taken out on this home.
Original Mortgage
$115,200
Outstanding Balance
$59,294
Interest Rate
5.74%
Mortgage Type
Construction
Estimated Equity
$205,366
Create a Home Valuation Report for This Property
The Home Valuation Report is an in-depth analysis detailing your home's value as well as a comparison with similar homes in the area
Purchase History
| Date | Buyer | Sale Price | Title Company |
|---|---|---|---|
| Olson Carroll | -- | None Available | |
| Olson Carroll E | $40,500 | None Available |
Source: Public Records
Mortgage History
| Date | Status | Borrower | Loan Amount |
|---|---|---|---|
| Open | Olson Carroll E | $115,200 |
Source: Public Records
Tax History
| Year | Tax Paid | Tax Assessment Tax Assessment Total Assessment is a certain percentage of the fair market value that is determined by local assessors to be the total taxable value of land and additions on the property. | Land | Improvement |
|---|---|---|---|---|
| 2025 | $2,680 | $169,630 | $33,550 | $136,080 |
| 2024 | $2,680 | $161,240 | $33,550 | $127,690 |
| 2023 | $2,670 | $161,240 | $33,550 | $127,690 |
| 2022 | $2,450 | $135,830 | $33,550 | $102,280 |
| 2021 | $2,486 | $122,420 | $33,550 | $88,870 |
| 2020 | $2,486 | $116,940 | $16,200 | $100,740 |
| 2019 | $2,270 | $0 | $0 | $0 |
| 2018 | $2,270 | $0 | $0 | $0 |
| 2017 | $2,220 | $0 | $0 | $0 |
| 2016 | $2,220 | $0 | $0 | $0 |
| 2015 | $2,130 | $0 | $0 | $0 |
| 2014 | $2,122 | $0 | $0 | $0 |
Source: Public Records
Map
Nearby Homes
- 207 N High St
- 102 N West Ave
- 213 Davenport Ave
- 105 W Rippey Ave
- 000 Xxx St
- 6352 N 95th Ave W
- 311 S Harrison Ave
- 305 Willow St
- 304 Willow St
- 309 Willow St
- 311 Willow St
- 310 Willow St
- 312 Willow St
- 303 Willow St
- 307 Willow St
- 302 Willow St
- 6839 Center St
- 9773 N 99th Ave W
- 102 Davenport St
- 201 Davenport St
Your Personal Tour Guide
Ask me questions while you tour the home.