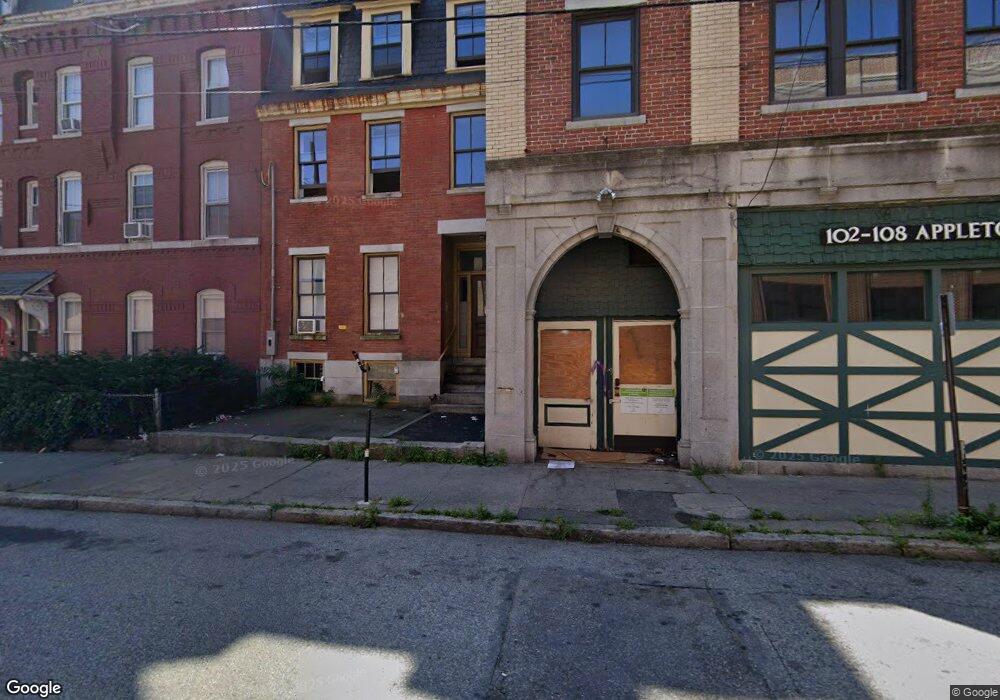
100 Appleton St Lowell, MA 01852
Back Central NeighborhoodEstimated Value: $602,000 - $676,000
3
Beds
3
Baths
2,468
Sq Ft
$256/Sq Ft
Est. Value
About This Home
This home is located at 100 Appleton St, Lowell, MA 01852 and is currently estimated at $632,333, approximately $256 per square foot. 100 Appleton St is a home located in Middlesex County with nearby schools including Moody Elementary School, Abraham Lincoln Elementary School, and Greenhalge Elementary School.
Ownership History
Date
Name
Owned For
Owner Type
Purchase Details
Closed on
Mar 28, 2025
Sold by
Paul H Dunigan Ret and Dunigan
Bought by
Appleton St Partners Llc
Current Estimated Value
Home Financials for this Owner
Home Financials are based on the most recent Mortgage that was taken out on this home.
Original Mortgage
$2,550,000
Outstanding Balance
$2,534,729
Interest Rate
6.87%
Mortgage Type
Commercial
Estimated Equity
-$1,902,396
Purchase Details
Closed on
Dec 18, 1992
Sold by
Spanos Michael
Bought by
Dunigan Paul H and Dunigan Helene
Create a Home Valuation Report for This Property
The Home Valuation Report is an in-depth analysis detailing your home's value as well as a comparison with similar homes in the area
Home Values in the Area
Average Home Value in this Area
Purchase History
| Date | Buyer | Sale Price | Title Company |
|---|---|---|---|
| Appleton St Partners Llc | $3,000,000 | None Available | |
| Appleton St Partners Llc | $3,000,000 | None Available | |
| Dunigan Paul H | $2,500 | -- | |
| Dunigan Paul H | $2,500 | -- |
Source: Public Records
Mortgage History
| Date | Status | Borrower | Loan Amount |
|---|---|---|---|
| Open | Appleton St Partners Llc | $2,550,000 | |
| Closed | Appleton St Partners Llc | $2,550,000 |
Source: Public Records
Tax History Compared to Growth
Tax History
| Year | Tax Paid | Tax Assessment Tax Assessment Total Assessment is a certain percentage of the fair market value that is determined by local assessors to be the total taxable value of land and additions on the property. | Land | Improvement |
|---|---|---|---|---|
| 2025 | $6,342 | $552,400 | $94,800 | $457,600 |
| 2024 | $6,009 | $504,500 | $85,500 | $419,000 |
| 2023 | $5,902 | $475,200 | $74,400 | $400,800 |
| 2022 | $5,365 | $422,800 | $58,600 | $364,200 |
| 2021 | $4,632 | $344,100 | $51,000 | $293,100 |
| 2020 | $4,131 | $309,200 | $42,500 | $266,700 |
| 2019 | $4,011 | $285,700 | $39,300 | $246,400 |
| 2018 | $3,646 | $253,400 | $37,500 | $215,900 |
| 2017 | $3,558 | $238,500 | $40,900 | $197,600 |
| 2016 | $3,341 | $220,400 | $41,100 | $179,300 |
| 2015 | $3,161 | $204,200 | $41,100 | $163,100 |
| 2013 | $2,463 | $164,100 | $47,400 | $116,700 |
Source: Public Records
Map
Nearby Homes
- 240 Jackson St Unit 623
- 30 Market St Unit 7
- 11 Cottage St
- 39 Groves Ave
- 61 Market St Unit 2B
- 128 Warren St Unit 12
- 200 Market St Unit 3010
- 200 Market St Unit A21
- 200 Market St Unit 619
- 200 Market St Unit 23A
- 23-33 Middle St Unit 11
- 23-33 Middle St Unit 6
- 17 Kearney Square Unit 201
- 17 Kearney Square Unit 205
- 95 S Highland St
- 491 Dutton St Unit 320
- 491 Dutton St Unit 415
- 491 Dutton St Unit 502
- 491 Dutton St Unit 504
- 201 Thorndike St Unit 501
- 100 Appleton St Unit 3
- 100 Appleton St Unit 2
- 102 Appleton St
- 90 Appleton St Unit 11
- 110 Appleton St Unit 3
- 114 Appleton St Unit 1
- 114 Appleton St Unit 3
- 114 Appleton St Unit 2
- 124 Appleton St
- 126 Appleton St
- 101 Gorham St
- 107 Gorham St
- 70 Middlesex St
- 60 Middlesex St
- 37 Elliott St
- 92 Gorham St Unit 201
- 92 Gorham St Unit 202
- 92 Gorham St Unit 301
- 78 Middlesex St
- 48 Middlesex St