
Landlord's Agent in 2015
Michael Plante
Residential Properties Ltd.
(401) 487-7600
53 Total Sales
Estimated Value: $746,000 - $889,000
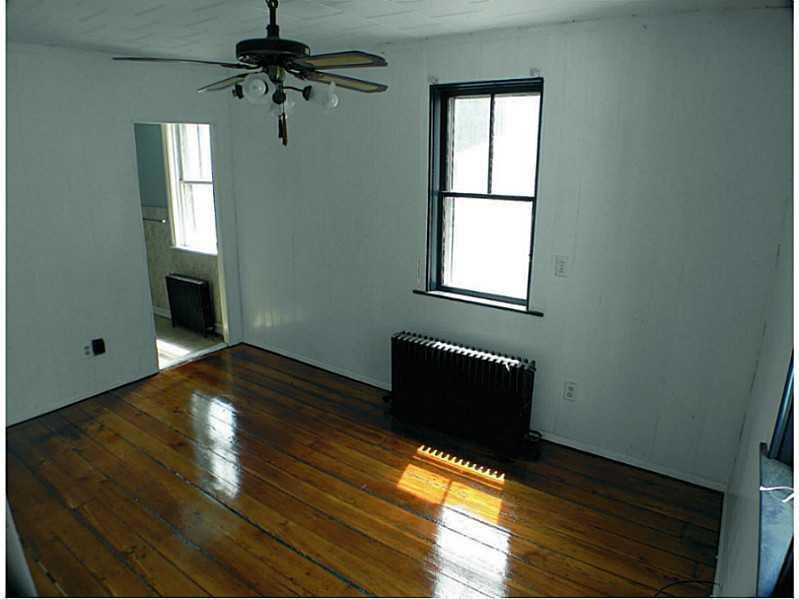
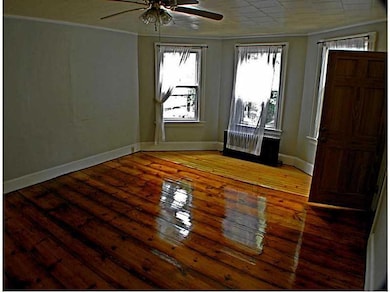
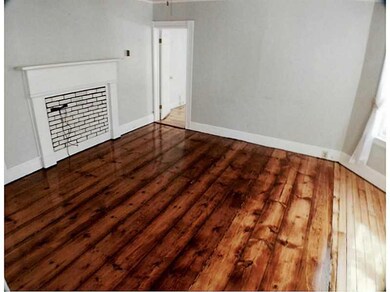
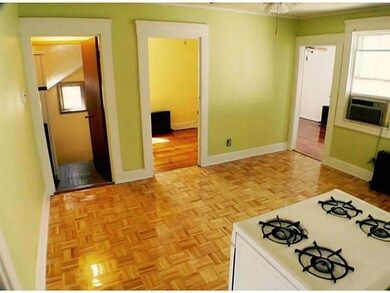
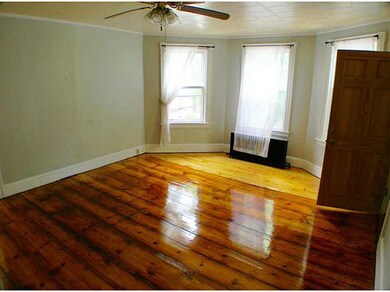
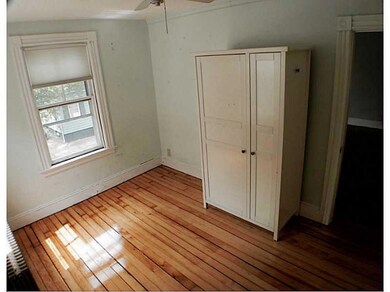
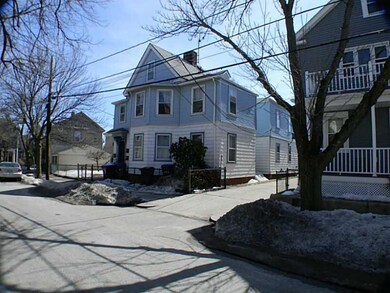
This home is located at 100 Arnold St Unit 2, Providence, RI 02906 since 09 June 2015 and is currently priced at $818,055. This property was built in 1930. 100 Arnold St Unit 2 is a home located in Providence County with nearby schools including Asa Messer Elementary School, Charles N. Fortes Elementary School, and Robert L. Bailey IV Elementary.
Last Agent to Rent the Property
Residential Properties Ltd. License #REB.0014946 Listed on: 06/09/2015
Last Renter's Agent
Residential Properties Ltd. License #REB.0014946 Listed on: 06/09/2015
| Date | Buyer | Sale Price | Title Company |
|---|---|---|---|
| Benson Allen C | $349,000 | -- | |
| Rose Edward D | -- | -- | |
| Rose Edward D | $357,500 | -- |
| Date | Status | Borrower | Loan Amount |
|---|---|---|---|
| Open | Benson Allen C | $261,750 | |
| Previous Owner | Rose Edward D | $229,000 | |
| Previous Owner | Rose Edward D | $250,000 | |
| Previous Owner | Rose Edward D | $31,000 |
| Date | Event | Price | List to Sale | Price per Sq Ft |
|---|---|---|---|---|
| 07/23/2015 07/23/15 | Rented | $1,100 | 0.0% | -- |
| 06/23/2015 06/23/15 | Under Contract | -- | -- | -- |
| 06/09/2015 06/09/15 | For Rent | $1,100 | -- | -- |
| Year | Tax Paid | Tax Assessment Tax Assessment Total Assessment is a certain percentage of the fair market value that is determined by local assessors to be the total taxable value of land and additions on the property. | Land | Improvement |
|---|---|---|---|---|
| 2025 | $11,948 | $853,400 | $435,000 | $418,400 |
| 2024 | $11,239 | $612,500 | $332,200 | $280,300 |
| 2023 | $11,239 | $612,500 | $332,200 | $280,300 |
| 2022 | $10,903 | $612,500 | $332,200 | $280,300 |
| 2021 | $9,664 | $393,500 | $210,800 | $182,700 |
| 2020 | $9,664 | $393,500 | $210,800 | $182,700 |
| 2019 | $9,664 | $393,500 | $210,800 | $182,700 |
| 2018 | $9,885 | $309,300 | $194,400 | $114,900 |
| 2017 | $9,777 | $305,900 | $194,400 | $111,500 |
| 2016 | $9,777 | $305,900 | $194,400 | $111,500 |
| 2015 | $9,308 | $281,200 | $194,400 | $86,800 |
| 2014 | $9,491 | $281,200 | $194,400 | $86,800 |
| 2013 | $9,491 | $281,200 | $194,400 | $86,800 |
Landlord's Agent in 2015
Michael Plante
Residential Properties Ltd.
(401) 487-7600
53 Total Sales
Source: State-Wide MLS
MLS Number: 1099027
APN: PROV-170208-000000-000000
Disclaimer: Certain information contained herein is derived from information provided by parties other than Homes.com. All information provided is deemed reliable, but is not guaranteed to be accurate and should be independently verified.
![]() IDX information is provided exclusively for personal, non-commercial use, and may not be used for any purpose other than to identify prospective properties consumers may be interested in purchasing. Information is deemed reliable but not guaranteed.
IDX information is provided exclusively for personal, non-commercial use, and may not be used for any purpose other than to identify prospective properties consumers may be interested in purchasing. Information is deemed reliable but not guaranteed.
Copyright © 2025 State-Wide MLS, Inc. All rights reserved.