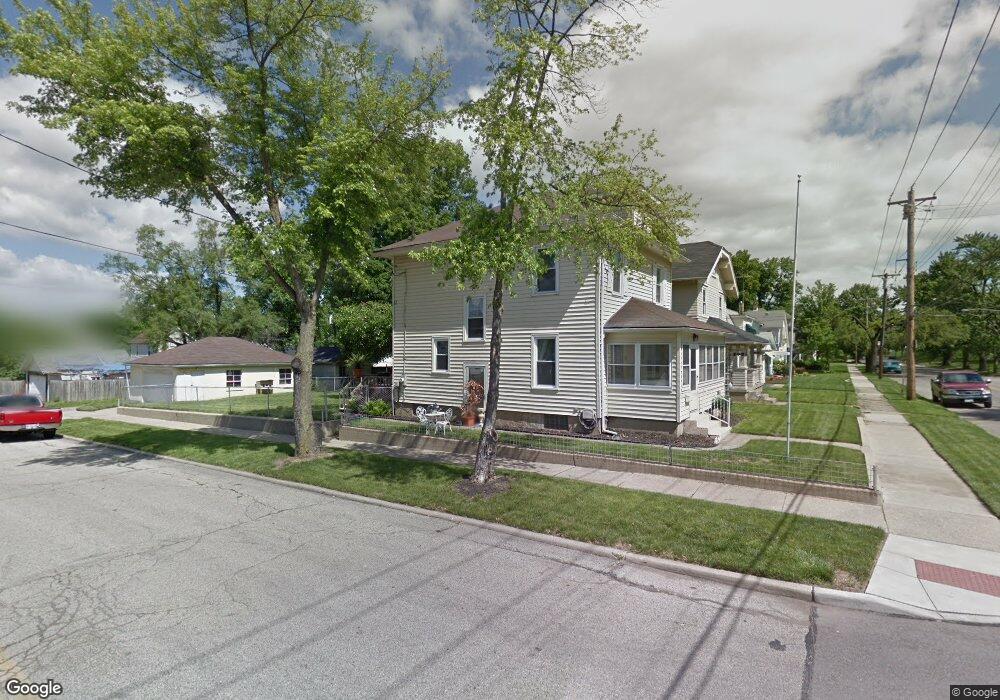
100 Bellemonte St Middletown, OH 45042
Sunset-Park Place NeighborhoodEstimated Value: $183,000 - $217,000
3
Beds
2
Baths
1,362
Sq Ft
$148/Sq Ft
Est. Value
About This Home
This home is located at 100 Bellemonte St, Middletown, OH 45042 and is currently estimated at $201,062, approximately $147 per square foot. 100 Bellemonte St is a home located in Butler County with nearby schools including Wildwood Elementary School, Highview 6th Grade Center, and Middletown Middle School.
Ownership History
Date
Name
Owned For
Owner Type
Purchase Details
Closed on
Jul 12, 2006
Sold by
Gilmore Joshua
Bought by
Swindall Timothy W
Current Estimated Value
Home Financials for this Owner
Home Financials are based on the most recent Mortgage that was taken out on this home.
Original Mortgage
$119,000
Interest Rate
9.62%
Mortgage Type
Purchase Money Mortgage
Purchase Details
Closed on
Dec 1, 2005
Sold by
Va
Bought by
Gilmore Joshua
Purchase Details
Closed on
Feb 15, 2005
Sold by
Daniels Samuel R
Bought by
Va
Purchase Details
Closed on
Jul 21, 1999
Sold by
Hobbs Billy E & William C Trs
Bought by
Daniels Samuel R and Daniels Amy L
Home Financials for this Owner
Home Financials are based on the most recent Mortgage that was taken out on this home.
Original Mortgage
$89,760
Interest Rate
7.54%
Mortgage Type
VA
Purchase Details
Closed on
Oct 1, 1990
Create a Home Valuation Report for This Property
The Home Valuation Report is an in-depth analysis detailing your home's value as well as a comparison with similar homes in the area
Home Values in the Area
Average Home Value in this Area
Purchase History
| Date | Buyer | Sale Price | Title Company |
|---|---|---|---|
| Swindall Timothy W | $119,000 | Overbrook Title Services | |
| Gilmore Joshua | -- | -- | |
| Va | $68,742 | -- | |
| Daniels Samuel R | $88,000 | -- | |
| -- | $45,000 | -- |
Source: Public Records
Mortgage History
| Date | Status | Borrower | Loan Amount |
|---|---|---|---|
| Open | Swindall Timothy W | $119,000 | |
| Previous Owner | Daniels Samuel R | $89,760 |
Source: Public Records
Tax History Compared to Growth
Tax History
| Year | Tax Paid | Tax Assessment Tax Assessment Total Assessment is a certain percentage of the fair market value that is determined by local assessors to be the total taxable value of land and additions on the property. | Land | Improvement |
|---|---|---|---|---|
| 2024 | $2,660 | $51,490 | $5,450 | $46,040 |
| 2023 | $2,644 | $48,030 | $5,450 | $42,580 |
| 2022 | $1,989 | $34,210 | $5,450 | $28,760 |
| 2021 | $1,912 | $34,210 | $5,450 | $28,760 |
| 2020 | $1,733 | $29,760 | $5,450 | $24,310 |
| 2019 | $1,966 | $27,130 | $5,430 | $21,700 |
| 2018 | $1,711 | $27,130 | $5,430 | $21,700 |
| 2017 | $1,715 | $27,130 | $5,430 | $21,700 |
| 2016 | $1,716 | $26,010 | $5,430 | $20,580 |
| 2015 | $1,691 | $26,010 | $5,430 | $20,580 |
| 2014 | $1,573 | $26,010 | $5,430 | $20,580 |
| 2013 | $1,573 | $25,730 | $5,430 | $20,300 |
Source: Public Records
Map
Nearby Homes
- 2506 North Ave
- 102 Franklin St
- 2617 Central Ave
- 2619 Central Ave
- 19 Mckinley St
- 2306 Linden Ave
- 13 Monroe St
- 2212 Linden Ave
- 2415 Superior Ave
- 2803 Milton Rd
- 2113 Central Ave
- 2112 Central Ave
- 2420 Superior Ave
- 2602 Elmo Place
- 416 Glen Ln
- 113 N Sutphin St
- 2007 Central Ave
- 2509 Elmo Place
- 2101 Arlington Ave
- 200 Santa fe Rd
- 102 Bellemonte St
- 104 Bellemonte St
- 14 Bellemonte St
- 2514 Manchester Ave
- 16 Bellemonte St
- 106 Bellemonte St
- 101 Franklin St
- 108 Bellemonte St
- 103 Franklin St
- 105 Franklin St
- 19 Bellemonte St
- 19 Franklin St
- 103 Bellemonte St
- 107 Franklin St
- 110 Bellemonte St
- 17 Bellemonte St
- 17 Franklin St
- 107 Bellemonte St
- 109 Franklin St
- 15 Bellemonte St