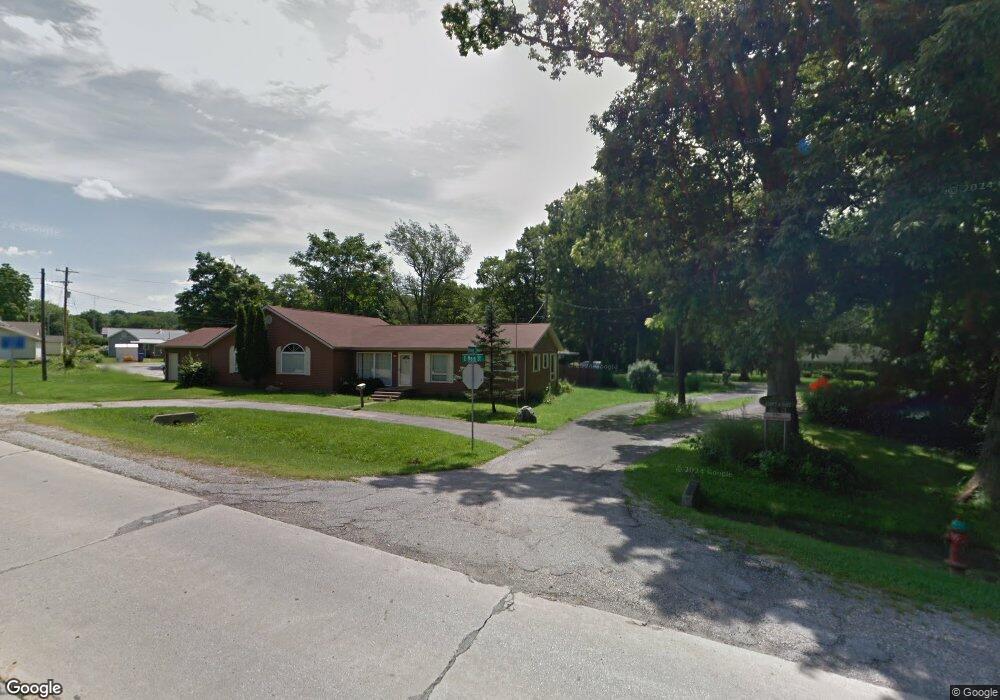
100 Bowen Ct Delphi, IN 46923
Estimated Value: $163,000 - $181,998
2
Beds
1
Bath
1,248
Sq Ft
$136/Sq Ft
Est. Value
About This Home
This home is located at 100 Bowen Ct, Delphi, IN 46923 and is currently estimated at $169,250, approximately $135 per square foot. 100 Bowen Ct is a home located in Carroll County with nearby schools including Delphi Community Elementary School, Delphi Community Middle School, and Delphi Community High School.
Ownership History
Date
Name
Owned For
Owner Type
Purchase Details
Closed on
Mar 5, 2012
Sold by
Boller Cassandra A and Morris Cassandra A
Bought by
Fletcher Michael L and Fletcher Elizabeth Ann
Current Estimated Value
Home Financials for this Owner
Home Financials are based on the most recent Mortgage that was taken out on this home.
Original Mortgage
$60,350
Outstanding Balance
$5,767
Interest Rate
3.11%
Mortgage Type
New Conventional
Estimated Equity
$163,483
Purchase Details
Closed on
Jan 6, 2012
Sold by
Morris Jarrod W
Bought by
Boller Cassandra A and Morris Cassandra A
Home Financials for this Owner
Home Financials are based on the most recent Mortgage that was taken out on this home.
Original Mortgage
$60,350
Outstanding Balance
$5,767
Interest Rate
3.11%
Mortgage Type
New Conventional
Estimated Equity
$163,483
Purchase Details
Closed on
Apr 8, 2003
Sold by
Servies Edward St
Bought by
Morris Jarrod
Create a Home Valuation Report for This Property
The Home Valuation Report is an in-depth analysis detailing your home's value as well as a comparison with similar homes in the area
Home Values in the Area
Average Home Value in this Area
Purchase History
| Date | Buyer | Sale Price | Title Company |
|---|---|---|---|
| Fletcher Michael L | -- | None Available | |
| Boller Cassandra A | -- | None Available | |
| Morris Jarrod | $76,000 | -- |
Source: Public Records
Mortgage History
| Date | Status | Borrower | Loan Amount |
|---|---|---|---|
| Open | Fletcher Michael L | $60,350 | |
| Previous Owner | Boller Cassandra A | $60,350 |
Source: Public Records
Tax History
| Year | Tax Paid | Tax Assessment Tax Assessment Total Assessment is a certain percentage of the fair market value that is determined by local assessors to be the total taxable value of land and additions on the property. | Land | Improvement |
|---|---|---|---|---|
| 2025 | $2,370 | $133,800 | $17,900 | $115,900 |
| 2024 | $2,370 | $118,300 | $17,900 | $100,400 |
| 2023 | $1,828 | $103,000 | $17,900 | $85,100 |
| 2022 | $1,828 | $92,500 | $16,300 | $76,200 |
| 2021 | $1,662 | $84,100 | $15,700 | $68,400 |
| 2020 | $1,602 | $81,200 | $15,700 | $65,500 |
| 2019 | $1,482 | $75,200 | $15,700 | $59,500 |
| 2018 | $1,455 | $72,200 | $15,700 | $56,500 |
| 2017 | $1,499 | $74,400 | $16,100 | $58,300 |
| 2016 | $1,451 | $72,000 | $16,100 | $55,900 |
| 2014 | $1,418 | $70,900 | $16,100 | $54,800 |
Source: Public Records
Map
Nearby Homes
- 519 E Franklin St
- 109 N Lafayette St
- 409 E Franklin St
- 116 Williston Ct
- 201 E Franklin St
- 112 Williston Ct
- 116 W North St
- 610 N Wilson St
- 317 N Market St
- 228 W Vine St
- 230 W Vine St
- 232 W Vine St
- 409 Heritage Dr
- 424 W Summit St
- 2660 N Dreifers Ave
- 1158 N Deer Meadows Rd
- 2801 N 930 W Unit 10
- 9331 W 310 N
- 35 Pond View Dr
- 10379 W 400 N
Your Personal Tour Guide
Ask me questions while you tour the home.