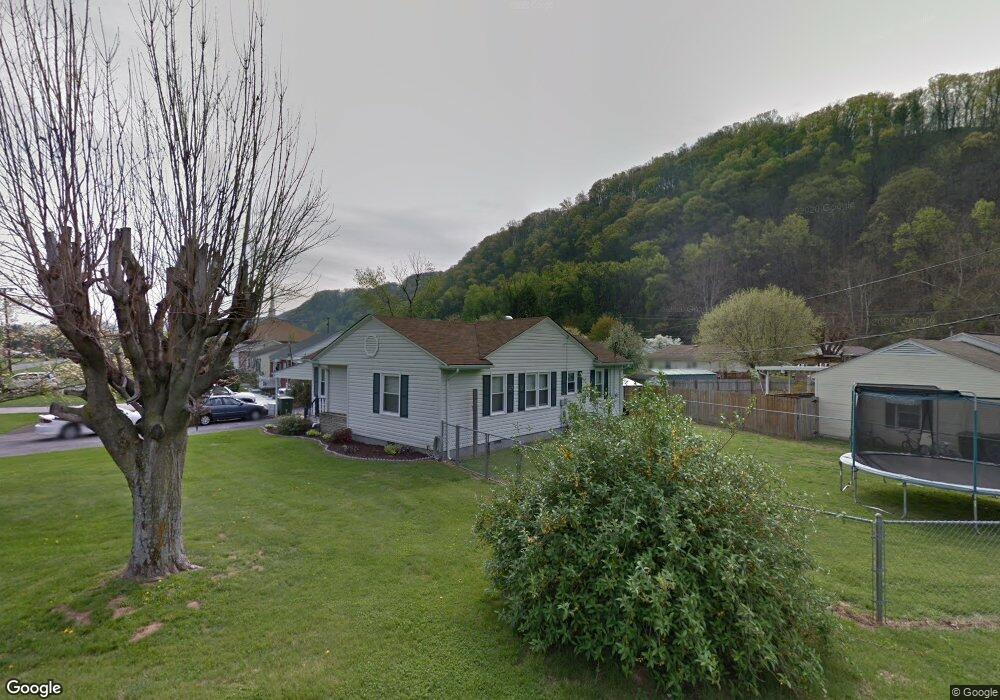
100 Broad St Elizabethton, TN 37643
Estimated Value: $233,000 - $275,000
--
Bed
2
Baths
1,433
Sq Ft
$178/Sq Ft
Est. Value
About This Home
This home is located at 100 Broad St, Elizabethton, TN 37643 and is currently estimated at $255,503, approximately $178 per square foot. 100 Broad St is a home located in Carter County with nearby schools including Elizabethton High School and East Tn Christian Home & Academy.
Ownership History
Date
Name
Owned For
Owner Type
Purchase Details
Closed on
Sep 25, 2017
Sold by
Seaboch Tina
Bought by
Seaboch James E
Current Estimated Value
Purchase Details
Closed on
Jun 10, 2016
Sold by
Payne Kenneth A
Bought by
Seaboch James E and Seaboch Tina
Home Financials for this Owner
Home Financials are based on the most recent Mortgage that was taken out on this home.
Original Mortgage
$122,776
Outstanding Balance
$97,716
Interest Rate
3.57%
Mortgage Type
New Conventional
Estimated Equity
$157,787
Purchase Details
Closed on
Dec 15, 2004
Sold by
Hailey Gerald
Bought by
Payne Kenneth A
Home Financials for this Owner
Home Financials are based on the most recent Mortgage that was taken out on this home.
Original Mortgage
$77,600
Interest Rate
5.67%
Purchase Details
Closed on
Nov 16, 2001
Sold by
Johnson Tanya
Bought by
Hailey Gerald
Purchase Details
Closed on
May 5, 1962
Bought by
Wilson Doyle and Wilson Janet
Create a Home Valuation Report for This Property
The Home Valuation Report is an in-depth analysis detailing your home's value as well as a comparison with similar homes in the area
Home Values in the Area
Average Home Value in this Area
Purchase History
| Date | Buyer | Sale Price | Title Company |
|---|---|---|---|
| Seaboch James E | -- | None Available | |
| Seaboch James E | $119,400 | -- | |
| Payne Kenneth A | $97,000 | -- | |
| Hailey Gerald | $68,000 | -- | |
| Wilson Doyle | -- | -- |
Source: Public Records
Mortgage History
| Date | Status | Borrower | Loan Amount |
|---|---|---|---|
| Open | Seaboch James E | $122,776 | |
| Previous Owner | Wilson Doyle | $77,600 |
Source: Public Records
Tax History Compared to Growth
Tax History
| Year | Tax Paid | Tax Assessment Tax Assessment Total Assessment is a certain percentage of the fair market value that is determined by local assessors to be the total taxable value of land and additions on the property. | Land | Improvement |
|---|---|---|---|---|
| 2024 | $1,172 | $35,500 | $9,425 | $26,075 |
| 2023 | $1,172 | $35,500 | $0 | $0 |
| 2022 | $1,278 | $35,500 | $9,425 | $26,075 |
| 2021 | $721 | $35,500 | $9,425 | $26,075 |
| 2020 | $1,281 | $35,500 | $9,425 | $26,075 |
| 2019 | $1,281 | $29,650 | $6,225 | $23,425 |
| 2018 | $1,263 | $29,650 | $6,225 | $23,425 |
| 2017 | $1,263 | $29,650 | $6,225 | $23,425 |
| 2016 | $1,257 | $29,650 | $6,225 | $23,425 |
| 2015 | $1,068 | $25,125 | $6,225 | $18,900 |
| 2014 | $1,063 | $24,900 | $6,200 | $18,700 |
Source: Public Records
Map
Nearby Homes