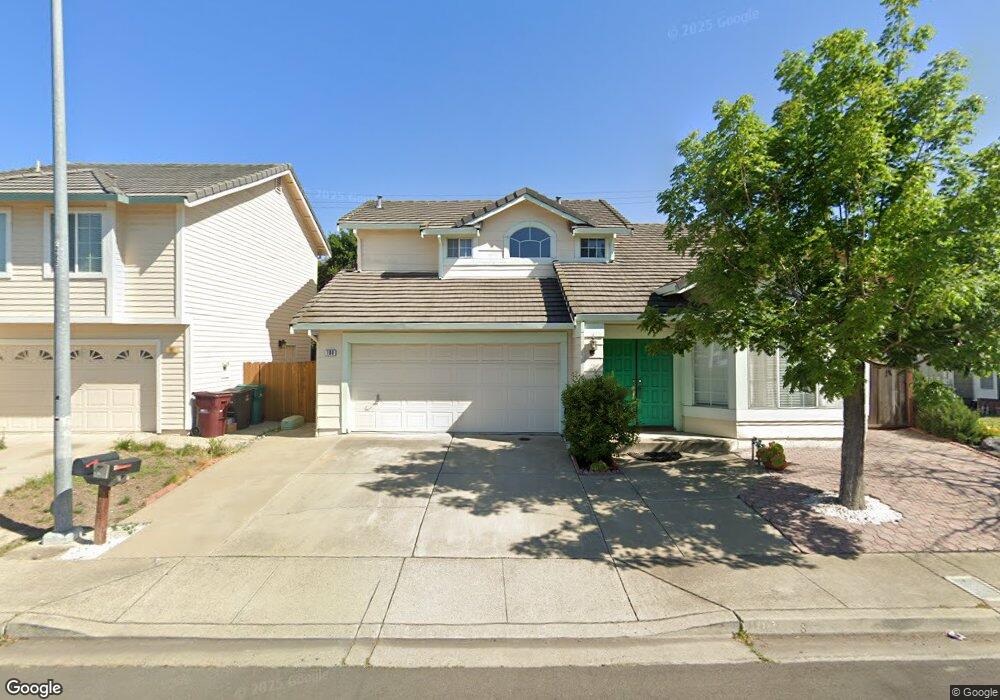
100 Brookstone Way Hayward, CA 94544
Whitman-Wocine NeighborhoodEstimated Value: $1,008,000 - $1,103,000
4
Beds
3
Baths
1,804
Sq Ft
$578/Sq Ft
Est. Value
About This Home
This home is located at 100 Brookstone Way, Hayward, CA 94544 and is currently estimated at $1,043,261, approximately $578 per square foot. 100 Brookstone Way is a home located in Alameda County with nearby schools including Harder Elementary School, Cesar Chavez Middle School, and Tennyson High School.
Ownership History
Date
Name
Owned For
Owner Type
Purchase Details
Closed on
Sep 19, 2012
Sold by
Huynh Julie
Bought by
Huynh David and Quach Mai Thi
Current Estimated Value
Home Financials for this Owner
Home Financials are based on the most recent Mortgage that was taken out on this home.
Original Mortgage
$329,600
Outstanding Balance
$54,795
Interest Rate
3.58%
Mortgage Type
New Conventional
Estimated Equity
$988,466
Purchase Details
Closed on
Feb 27, 2002
Sold by
Vannucci Joseph W and Vannucci Suzanne F
Bought by
Hunt Jerry
Home Financials for this Owner
Home Financials are based on the most recent Mortgage that was taken out on this home.
Original Mortgage
$100,000
Interest Rate
6.94%
Mortgage Type
Seller Take Back
Purchase Details
Closed on
Feb 26, 2002
Sold by
Rodriguez Remedios
Bought by
Huynh David and Quach Mai Thi
Home Financials for this Owner
Home Financials are based on the most recent Mortgage that was taken out on this home.
Original Mortgage
$100,000
Interest Rate
6.94%
Mortgage Type
Seller Take Back
Create a Home Valuation Report for This Property
The Home Valuation Report is an in-depth analysis detailing your home's value as well as a comparison with similar homes in the area
Home Values in the Area
Average Home Value in this Area
Purchase History
| Date | Buyer | Sale Price | Title Company |
|---|---|---|---|
| Huynh David | -- | Placer Title Company | |
| Hunt Jerry | $120,000 | Fidelity National Title Co | |
| Huynh David | $449,000 | Fidelity National Title Co |
Source: Public Records
Mortgage History
| Date | Status | Borrower | Loan Amount |
|---|---|---|---|
| Open | Huynh David | $329,600 | |
| Closed | Hunt Jerry | $100,000 | |
| Closed | Huynh David | $359,200 |
Source: Public Records
Tax History Compared to Growth
Tax History
| Year | Tax Paid | Tax Assessment Tax Assessment Total Assessment is a certain percentage of the fair market value that is determined by local assessors to be the total taxable value of land and additions on the property. | Land | Improvement |
|---|---|---|---|---|
| 2025 | $7,351 | $589,083 | $178,825 | $417,258 |
| 2024 | $7,351 | $577,397 | $175,319 | $409,078 |
| 2023 | $7,236 | $572,941 | $171,882 | $401,059 |
| 2022 | $7,091 | $554,708 | $168,512 | $393,196 |
| 2021 | $7,033 | $543,695 | $165,208 | $385,487 |
| 2020 | $6,956 | $545,050 | $163,515 | $381,535 |
| 2019 | $7,010 | $534,365 | $160,309 | $374,056 |
| 2018 | $6,584 | $523,890 | $157,167 | $366,723 |
| 2017 | $6,464 | $513,620 | $154,086 | $359,534 |
| 2016 | $6,105 | $503,551 | $151,065 | $352,486 |
| 2015 | $5,924 | $495,990 | $148,797 | $347,193 |
| 2014 | $5,506 | $475,000 | $142,500 | $332,500 |
Source: Public Records
Map
Nearby Homes
- 25478 Huntwood Ave Unit 18
- 25696 Lander Ave
- 26361 Huntwood Ave
- 26047 Gading Rd
- 265 Berry Ave
- 26231 Gamboa St
- 318 Dumont Ave
- 26132 Jane Ave
- 25231 Whitman St Unit 103
- 399 Schafer Rd
- 25943 Dollar St
- 99 Austin Ave
- 24920 Soto Rd
- 25345 Custom Dr
- 250 Schafer Rd
- 25353 Tarman Ave
- 25109 Angelina Ln Unit 17
- 26632 Luvena Dr
- 25275 Tarman Ave
- 24970 Cypress Ave
- 90 Brookstone Way
- 25900 Tarragon St
- 82 Brookstone Way
- 25922 Tarragon St
- 99 Brookstone Way
- 87 Brookstone Way
- 25944 Tarragon St
- 72 Brookstone Way
- 79 Brookstone Way
- 25968 Tarragon St
- 25973 Tarragon St
- 64 Brookstone Way
- 67 Brookstone Way
- 25900 Meadowmist Dr
- 25872 Meadowmist Dr
- 25990 Tarragon St
- 54 Brookstone Way
- 25995 Tarragon St
- 25916 Meadowmist Dr
- 25739 Soto Rd