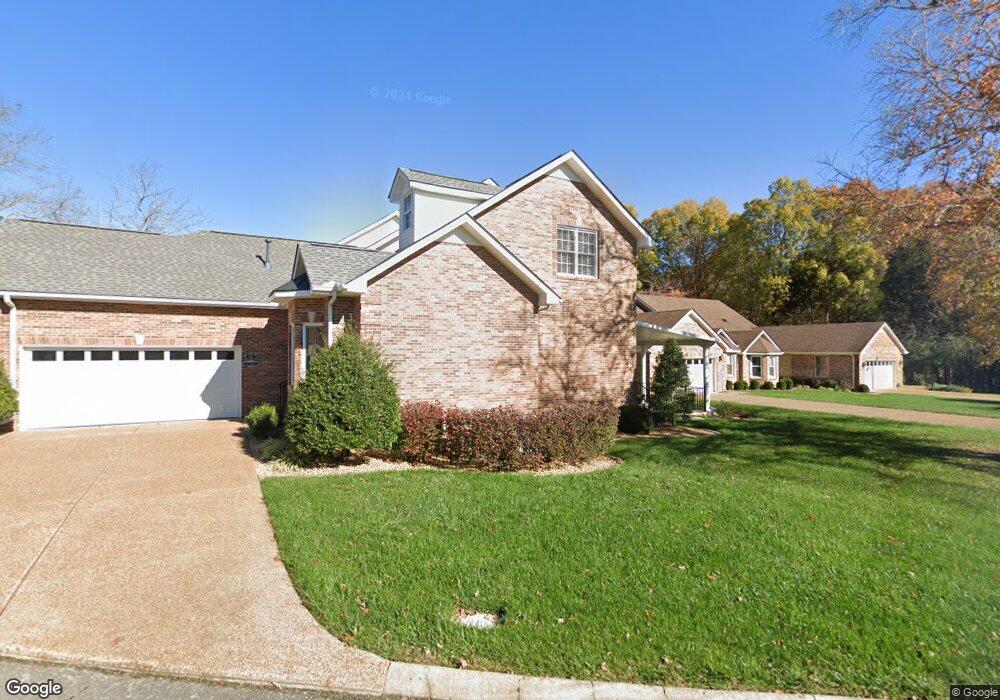
100 Chadsworth Place Tullahoma, TN 37388
Estimated Value: $387,000 - $430,000
--
Bed
3
Baths
1,994
Sq Ft
$207/Sq Ft
Est. Value
About This Home
This home is located at 100 Chadsworth Place, Tullahoma, TN 37388 and is currently estimated at $413,096, approximately $207 per square foot. 100 Chadsworth Place is a home located in Coffee County with nearby schools including Tullahoma High School, Highland Rim Christian Academy, and Tullahoma Christian Academy.
Ownership History
Date
Name
Owned For
Owner Type
Purchase Details
Closed on
Oct 7, 2010
Sold by
Vanpatten Robert J
Bought by
Vanpatten Robert J
Current Estimated Value
Purchase Details
Closed on
Aug 29, 2010
Sold by
Rogers Billy W
Bought by
Vanpatten Robert J Suc Trus
Purchase Details
Closed on
Mar 1, 2007
Sold by
Barebo Mark Co
Bought by
Rogers Billy W
Purchase Details
Closed on
Feb 8, 2007
Sold by
Barebo Living Trust C/O
Bought by
Rogers Billy W Eutx J Ann
Purchase Details
Closed on
Feb 3, 2004
Bought by
Barebo Living Trust
Purchase Details
Closed on
May 28, 2002
Sold by
Moore Greg
Bought by
Pack Kenneth H
Home Financials for this Owner
Home Financials are based on the most recent Mortgage that was taken out on this home.
Original Mortgage
$250,000
Interest Rate
6.92%
Create a Home Valuation Report for This Property
The Home Valuation Report is an in-depth analysis detailing your home's value as well as a comparison with similar homes in the area
Home Values in the Area
Average Home Value in this Area
Purchase History
| Date | Buyer | Sale Price | Title Company |
|---|---|---|---|
| Vanpatten Robert J | -- | -- | |
| Vanpatten Robert J Suc Trus | $195,000 | -- | |
| Rogers Billy W | $195,000 | -- | |
| Rogers Billy W Eutx J Ann | $195,000 | -- | |
| Barebo Living Trust | $180,000 | -- | |
| Pack Kenneth H | $20,000 | -- |
Source: Public Records
Mortgage History
| Date | Status | Borrower | Loan Amount |
|---|---|---|---|
| Previous Owner | Pack Kenneth H | $250,000 |
Source: Public Records
Tax History Compared to Growth
Tax History
| Year | Tax Paid | Tax Assessment Tax Assessment Total Assessment is a certain percentage of the fair market value that is determined by local assessors to be the total taxable value of land and additions on the property. | Land | Improvement |
|---|---|---|---|---|
| 2024 | $2,902 | $74,300 | $5,000 | $69,300 |
| 2023 | $2,902 | $74,300 | $0 | $0 |
| 2022 | $2,978 | $74,300 | $5,000 | $69,300 |
| 2021 | $2,852 | $56,900 | $5,000 | $51,900 |
| 2020 | $2,852 | $56,900 | $5,000 | $51,900 |
| 2019 | $2,852 | $56,900 | $5,000 | $51,900 |
| 2018 | $2,852 | $56,900 | $5,000 | $51,900 |
| 2017 | $2,778 | $50,800 | $5,000 | $45,800 |
| 2016 | $2,779 | $50,800 | $5,000 | $45,800 |
| 2015 | $2,667 | $48,750 | $5,000 | $43,750 |
| 2014 | $2,667 | $48,755 | $0 | $0 |
Source: Public Records
Map
Nearby Homes
- 2108 Country Club Dr
- 2124 Ovoca Rd
- 116 Courtside Ln
- 15 Pinewood Cove
- 2022 Country Club Dr
- 20 Pine Ridge Dr
- 16 Pine Ridge Dr
- 18 Pine Ridge Dr
- 14 Pinewood Cove
- 73 Pine Ridge Dr
- 74 Pine Ridge Dr
- 17 Pine Ridge Dr
- 1809 Country Club Dr
- 43 Pine Ridge Dr
- 309 Setters Ln W
- 27 Pine Ridge Dr
- 72 Pine Ridge Dr
- 45 Tulip Poplar Ct
- 50 Pine Ridge Dr
- 21 Pine Ridge Dr
- 102 Chadsworth Place
- 10 Kensington Ln
- 10 Kensington Ln
- 2 Chadsworth Place
- 3 Chadsworth Place
- 3 Chadsworth Place
- 3 Chadsworth Place
- 1 Chadsworth Place
- 6 Chadsworth Place
- 5 Chadsworth Place
- 113 Kensington Ln
- 4 Chadsworth Place
- 7 Chadsworth Place
- 1 Castle Walk
- 8 Chadsworth Place
- 0 Kensington Ln
- 2 Castle Walk
- 3 Castle Walk
- 4 Castle Walk
- 4 Castle Walk Unit 4