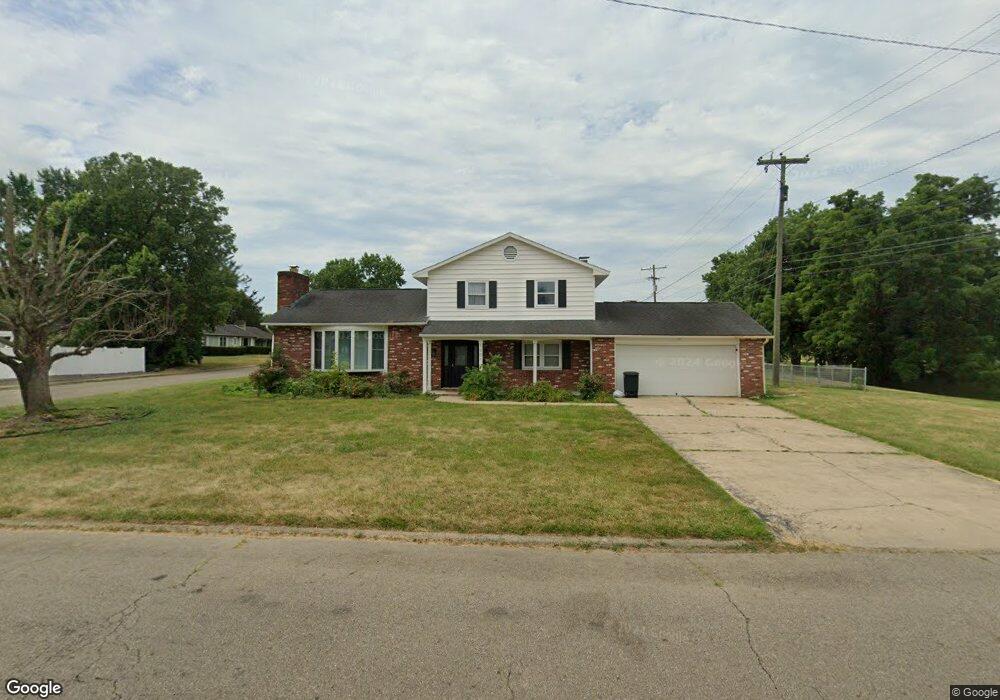
100 Cherry St Waverly, OH 45690
Estimated Value: $371,000 - $474,000
3
Beds
3
Baths
2,415
Sq Ft
$169/Sq Ft
Est. Value
About This Home
This home is located at 100 Cherry St, Waverly, OH 45690 and is currently estimated at $409,328, approximately $169 per square foot. 100 Cherry St is a home located in Pike County with nearby schools including Waverly Primary School, Waverly Intermediate School, and Waverly Junior High School.
Ownership History
Date
Name
Owned For
Owner Type
Purchase Details
Closed on
Dec 9, 2021
Sold by
Stevens Molly A and The Klinker Keystone Preservat
Bought by
Taylor Janessa L and Taylor James J
Current Estimated Value
Home Financials for this Owner
Home Financials are based on the most recent Mortgage that was taken out on this home.
Original Mortgage
$235,000
Outstanding Balance
$216,138
Interest Rate
3.11%
Mortgage Type
New Conventional
Estimated Equity
$193,190
Purchase Details
Closed on
Oct 11, 2017
Sold by
Klinker William B and Klinker Ann L
Bought by
Stevens Molly A and The Klinker Keystone Preservation Trust
Purchase Details
Closed on
Dec 11, 2014
Sold by
Klinker Ann Lynn
Bought by
Klinker William B and Klinker Ann Lynn
Purchase Details
Closed on
Jul 15, 2005
Sold by
Klinker Ann Lynn
Bought by
Klinker Ann L and Ann L Klinker Trust
Create a Home Valuation Report for This Property
The Home Valuation Report is an in-depth analysis detailing your home's value as well as a comparison with similar homes in the area
Home Values in the Area
Average Home Value in this Area
Purchase History
| Date | Buyer | Sale Price | Title Company |
|---|---|---|---|
| Taylor Janessa L | $385,000 | None Available | |
| Stevens Molly A | -- | None Available | |
| Klinker William B | -- | None Available | |
| Klinker William B | -- | None Available | |
| Klinker Ann Lynn | -- | None Available | |
| Klinker Ann L | -- | None Available |
Source: Public Records
Mortgage History
| Date | Status | Borrower | Loan Amount |
|---|---|---|---|
| Open | Taylor Janessa L | $235,000 |
Source: Public Records
Tax History
| Year | Tax Paid | Tax Assessment Tax Assessment Total Assessment is a certain percentage of the fair market value that is determined by local assessors to be the total taxable value of land and additions on the property. | Land | Improvement |
|---|---|---|---|---|
| 2024 | $4,176 | $113,470 | $6,570 | $106,900 |
| 2023 | $4,016 | $113,470 | $6,570 | $106,900 |
| 2022 | $3,662 | $87,630 | $3,240 | $84,390 |
| 2021 | $3,150 | $87,630 | $3,240 | $84,390 |
| 2020 | $3,151 | $87,630 | $3,240 | $84,390 |
| 2019 | $2,640 | $74,240 | $2,720 | $71,520 |
| 2018 | $2,340 | $74,240 | $2,720 | $71,520 |
| 2017 | $2,601 | $88,280 | $2,720 | $85,560 |
| 2016 | $2,546 | $70,460 | $5,190 | $65,270 |
| 2015 | $2,546 | $70,460 | $5,190 | $65,270 |
| 2014 | $2,464 | $70,460 | $5,190 | $65,270 |
| 2013 | $2,496 | $70,460 | $5,190 | $65,270 |
| 2012 | $2,555 | $70,460 | $5,190 | $65,270 |
Source: Public Records
Map
Nearby Homes
Your Personal Tour Guide
Ask me questions while you tour the home.