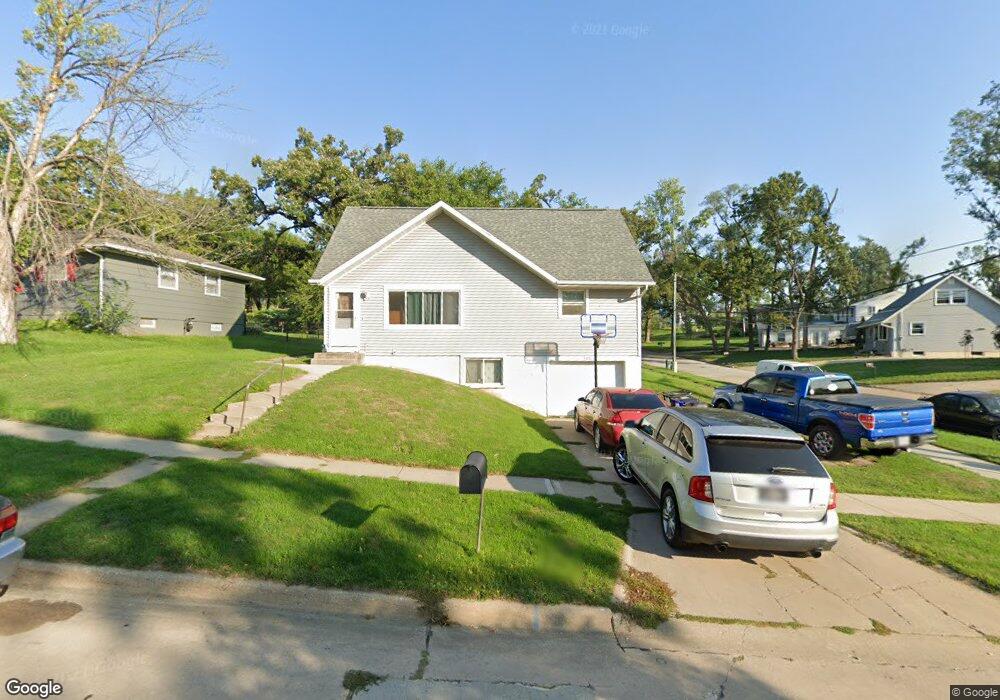
100 Clover Dr SW Cedar Rapids, IA 52404
Southwest Area NeighborhoodEstimated Value: $177,000 - $194,000
4
Beds
1
Bath
1,653
Sq Ft
$112/Sq Ft
Est. Value
About This Home
This home is located at 100 Clover Dr SW, Cedar Rapids, IA 52404 and is currently estimated at $185,433, approximately $112 per square foot. 100 Clover Dr SW is a home located in Linn County with nearby schools including Junction City Elementary School, Grant Elementary School, and Bruce Hall Day Treatment Center.
Ownership History
Date
Name
Owned For
Owner Type
Purchase Details
Closed on
Jul 25, 2008
Sold by
Kmm Llc
Bought by
Sanderson Benjamin P
Current Estimated Value
Home Financials for this Owner
Home Financials are based on the most recent Mortgage that was taken out on this home.
Original Mortgage
$100,300
Outstanding Balance
$49,783
Interest Rate
6.5%
Mortgage Type
Unknown
Estimated Equity
$135,650
Purchase Details
Closed on
Jun 3, 2001
Sold by
Malloy Dennis D and Malloy Nathalie K
Bought by
K M M Llc
Home Financials for this Owner
Home Financials are based on the most recent Mortgage that was taken out on this home.
Original Mortgage
$72,000
Interest Rate
6.99%
Mortgage Type
Balloon
Purchase Details
Closed on
May 4, 2001
Sold by
Sovers Robert J and Sovers Martha J
Bought by
Malloy Dennis D and Malloy Nathalie K
Home Financials for this Owner
Home Financials are based on the most recent Mortgage that was taken out on this home.
Original Mortgage
$72,000
Interest Rate
6.99%
Mortgage Type
Balloon
Create a Home Valuation Report for This Property
The Home Valuation Report is an in-depth analysis detailing your home's value as well as a comparison with similar homes in the area
Home Values in the Area
Average Home Value in this Area
Purchase History
| Date | Buyer | Sale Price | Title Company |
|---|---|---|---|
| Sanderson Benjamin P | $79,500 | None Available | |
| K M M Llc | -- | -- | |
| Malloy Dennis D | $79,500 | -- |
Source: Public Records
Mortgage History
| Date | Status | Borrower | Loan Amount |
|---|---|---|---|
| Open | Sanderson Benjamin P | $100,300 | |
| Previous Owner | Malloy Dennis D | $72,000 |
Source: Public Records
Tax History Compared to Growth
Tax History
| Year | Tax Paid | Tax Assessment Tax Assessment Total Assessment is a certain percentage of the fair market value that is determined by local assessors to be the total taxable value of land and additions on the property. | Land | Improvement |
|---|---|---|---|---|
| 2025 | $2,730 | $175,000 | $35,900 | $139,100 |
| 2024 | $2,540 | $154,300 | $35,900 | $118,400 |
| 2023 | $2,540 | $154,300 | $35,900 | $118,400 |
| 2022 | $2,382 | $120,400 | $32,300 | $88,100 |
| 2021 | $2,376 | $115,000 | $28,700 | $86,300 |
| 2020 | $2,376 | $107,700 | $28,700 | $79,000 |
| 2019 | $2,134 | $99,000 | $25,100 | $73,900 |
| 2018 | $2,076 | $99,000 | $25,100 | $73,900 |
| 2017 | $2,064 | $97,100 | $25,100 | $72,000 |
| 2016 | $2,064 | $97,100 | $25,100 | $72,000 |
| 2015 | $2,092 | $98,351 | $25,127 | $73,224 |
| 2014 | $2,092 | $100,592 | $25,127 | $75,465 |
| 2013 | $2,094 | $100,592 | $25,127 | $75,465 |
Source: Public Records
Map
Nearby Homes
- 90 29th Ave SW
- 148 33rd Ave SW
- 3212 Southland St SW
- 2937 Southland St SW
- 2818 Southland St SW
- 3010 Bowling St SW
- 9 33rd Ave SW
- 42 Park Village Ave SW
- 2955 Bowling St SW Unit E238
- 51 29th Avenue Dr SW Unit D11
- 51 29th Avenue Dr SW Unit C22
- 109 Evelyn Dr SW
- 2601 Teresa Dr SW
- 2401 Victoria Dr SW
- 2536 L St SW
- 186 22nd Ave SW
- 2021 Hamilton St SW
- 2321 Lauren Dr SW
- 2511 Indiana St SW
- 2417 Illinois St SW
- 106 Clover Dr SW
- 3012 Outlook Dr SW
- 112 Clover Dr SW
- 3102 Outlook Dr SW
- 3021 Outlook Dr SW
- 3015 Outlook Dr SW
- 3025 Outlook Dr SW
- 3108 Outlook Dr SW
- 3031 Outlook Dr SW
- 118 Clover Dr SW
- 3007 Outlook Dr SW
- 125 Clover Dr SW
- 3107 Outlook Dr SW
- 3004 Outlook Dr SW
- 3114 Outlook Dr SW
- 124 Clover Dr SW
- 3113 Clover Dr SW
- 114 Red Wing Rd SW
- 2937 Outlook Dr SW
- 108 Red Wing Rd SW