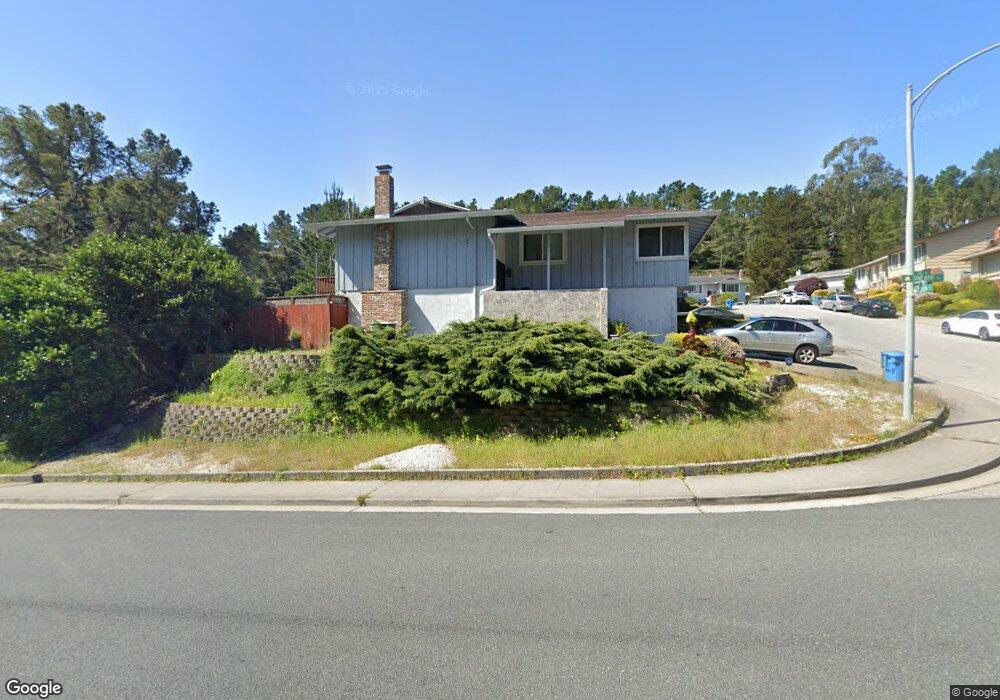
100 Colusa Ct San Bruno, CA 94066
Portola Highlands NeighborhoodEstimated Value: $1,440,000 - $1,948,000
4
Beds
3
Baths
2,300
Sq Ft
$755/Sq Ft
Est. Value
About This Home
This home is located at 100 Colusa Ct, San Bruno, CA 94066 and is currently estimated at $1,736,469, approximately $754 per square foot. 100 Colusa Ct is a home located in San Mateo County with nearby schools including Portola Elementary School, Parkside Intermediate School, and Capuchino High School.
Ownership History
Date
Name
Owned For
Owner Type
Purchase Details
Closed on
Dec 14, 2019
Sold by
Nguyen Kevin
Bought by
Nguyen Kevin C and Nguyen Thao T
Current Estimated Value
Purchase Details
Closed on
Dec 30, 2009
Sold by
Deutsche Bank National Trust Company
Bought by
Nguyen Kevin
Home Financials for this Owner
Home Financials are based on the most recent Mortgage that was taken out on this home.
Original Mortgage
$250,000
Outstanding Balance
$164,805
Interest Rate
5.03%
Mortgage Type
New Conventional
Estimated Equity
$1,571,664
Purchase Details
Closed on
Apr 2, 2009
Sold by
Nasser Wajdy E
Bought by
Indymac Federal Bank Fsb
Purchase Details
Closed on
Oct 3, 2005
Sold by
Nasser Julia W
Bought by
Nasser Wajdy E
Home Financials for this Owner
Home Financials are based on the most recent Mortgage that was taken out on this home.
Original Mortgage
$550,000
Interest Rate
1%
Mortgage Type
Purchase Money Mortgage
Create a Home Valuation Report for This Property
The Home Valuation Report is an in-depth analysis detailing your home's value as well as a comparison with similar homes in the area
Home Values in the Area
Average Home Value in this Area
Purchase History
| Date | Buyer | Sale Price | Title Company |
|---|---|---|---|
| Nguyen Kevin C | -- | None Available | |
| Nguyen Kevin | $708,000 | Chicago Title Company | |
| Nguyen Kevin | -- | Chicago Title Company | |
| Deutsche Bank National Trust Company | -- | Chicago Title Company | |
| Indymac Federal Bank Fsb | $633,118 | None Available | |
| Nasser Wajdy E | -- | Alliance Title |
Source: Public Records
Mortgage History
| Date | Status | Borrower | Loan Amount |
|---|---|---|---|
| Open | Nguyen Kevin | $250,000 | |
| Previous Owner | Nasser Wajdy E | $550,000 |
Source: Public Records
Tax History Compared to Growth
Tax History
| Year | Tax Paid | Tax Assessment Tax Assessment Total Assessment is a certain percentage of the fair market value that is determined by local assessors to be the total taxable value of land and additions on the property. | Land | Improvement |
|---|---|---|---|---|
| 2025 | $11,269 | $913,886 | $456,943 | $456,943 |
| 2023 | $11,269 | $878,400 | $439,200 | $439,200 |
| 2022 | $9,504 | $861,178 | $430,589 | $430,589 |
| 2021 | $9,381 | $844,294 | $422,147 | $422,147 |
| 2020 | $9,292 | $835,638 | $417,819 | $417,819 |
| 2019 | $9,139 | $819,254 | $409,627 | $409,627 |
| 2018 | $8,684 | $803,192 | $401,596 | $401,596 |
| 2017 | $8,590 | $787,444 | $393,722 | $393,722 |
| 2016 | $8,416 | $772,004 | $386,002 | $386,002 |
| 2015 | $8,304 | $760,408 | $380,204 | $380,204 |
| 2014 | $8,181 | $745,514 | $372,757 | $372,757 |
Source: Public Records
Map
Nearby Homes
- 2861 Cottonwood Dr
- 225 Merced Dr
- 2550 Maywood Dr
- 2801 Chabot Dr
- 2518 Albright Way
- 2161 Rollingwood Dr
- 2081 Rollingwood Dr
- 3392 Fleetwood Dr
- 2555 Crestmoor Dr
- 2410 Tipperary Ave
- 2425 Crestmoor Dr
- 3151 Summit Rd
- 2641 Ridgeway Ave
- 413 Piccadilly Place Unit 13
- 2270 Kenry Way
- 3811 Madera Way
- 2340 Princeton Dr
- 123 Appian Way
- 408 Boardwalk Ave Unit 1
- 465 Valverde Dr
- 110 Colusa Ct
- 160 Alameda Place
- 120 Colusa Ct
- 150 Alameda Place
- 190 Colusa Ct
- 130 Colusa Ct
- 180 Colusa Ct
- 140 Alameda Place
- 170 Colusa Ct
- 3111 Sneath Ln
- 160 Colusa Ct
- 140 Colusa Ct
- 130 Alameda Place
- 100 Alameda Place
- 3100 Sneath Ln
- 110 Alameda Place
- 3121 Sneath Ln
- 120 Alameda Place
- 150 Colusa Ct
- 146 Colusa Ct