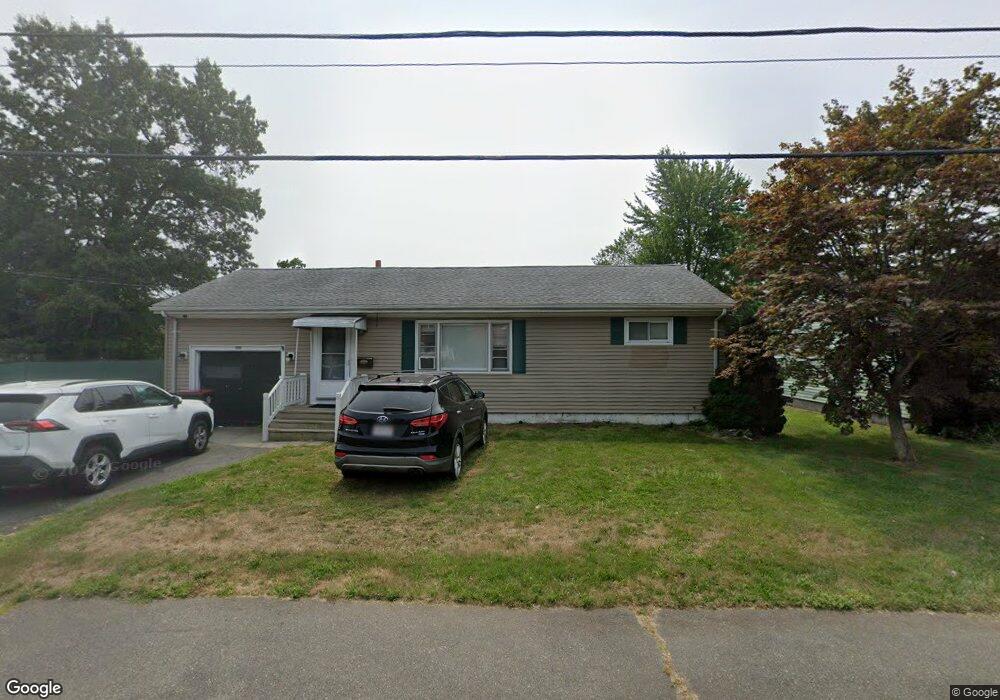
100 Dover St Brockton, MA 02301
Clifton Heights NeighborhoodEstimated Value: $411,000 - $456,000
3
Beds
2
Baths
936
Sq Ft
$454/Sq Ft
Est. Value
About This Home
This home is located at 100 Dover St, Brockton, MA 02301 and is currently estimated at $424,777, approximately $453 per square foot. 100 Dover St is a home located in Plymouth County with nearby schools including Arnone Elementary School, Joseph F. Plouffe Middle School, and Trinity Catholic Academy.
Ownership History
Date
Name
Owned For
Owner Type
Purchase Details
Closed on
Jul 30, 2004
Sold by
Obrien Paul and Obrien Janet E
Bought by
Obrien Paul and Obrien Janet E
Current Estimated Value
Home Financials for this Owner
Home Financials are based on the most recent Mortgage that was taken out on this home.
Original Mortgage
$45,600
Outstanding Balance
$23,106
Interest Rate
6.33%
Mortgage Type
Purchase Money Mortgage
Estimated Equity
$401,671
Purchase Details
Closed on
Jul 11, 1994
Sold by
Brazas F John
Bought by
Obrien Paul
Home Financials for this Owner
Home Financials are based on the most recent Mortgage that was taken out on this home.
Original Mortgage
$51,900
Interest Rate
8.51%
Mortgage Type
Purchase Money Mortgage
Create a Home Valuation Report for This Property
The Home Valuation Report is an in-depth analysis detailing your home's value as well as a comparison with similar homes in the area
Home Values in the Area
Average Home Value in this Area
Purchase History
| Date | Buyer | Sale Price | Title Company |
|---|---|---|---|
| Obrien Paul | -- | -- | |
| Obrien Paul | $64,900 | -- | |
| Obrien Paul | $64,900 | -- |
Source: Public Records
Mortgage History
| Date | Status | Borrower | Loan Amount |
|---|---|---|---|
| Open | Obrien Paul | $45,600 | |
| Previous Owner | Obrien Paul | $49,850 | |
| Previous Owner | Obrien Paul | $51,900 |
Source: Public Records
Tax History
| Year | Tax Paid | Tax Assessment Tax Assessment Total Assessment is a certain percentage of the fair market value that is determined by local assessors to be the total taxable value of land and additions on the property. | Land | Improvement |
|---|---|---|---|---|
| 2025 | $4,634 | $382,700 | $140,600 | $242,100 |
| 2024 | $4,559 | $379,300 | $140,600 | $238,700 |
| 2023 | $4,435 | $341,700 | $106,700 | $235,000 |
| 2022 | $4,022 | $287,900 | $97,100 | $190,800 |
| 2021 | $3,928 | $270,900 | $81,100 | $189,800 |
| 2020 | $3,869 | $255,400 | $75,500 | $179,900 |
| 2019 | $3,542 | $227,900 | $73,500 | $154,400 |
| 2018 | $2,822 | $182,800 | $73,500 | $109,300 |
| 2017 | $2,822 | $175,300 | $73,500 | $101,800 |
| 2016 | $2,904 | $167,300 | $71,400 | $95,900 |
| 2015 | $2,668 | $147,000 | $71,400 | $75,600 |
| 2014 | $2,632 | $145,200 | $71,400 | $73,800 |
Source: Public Records
Map
Nearby Homes
Your Personal Tour Guide
Ask me questions while you tour the home.