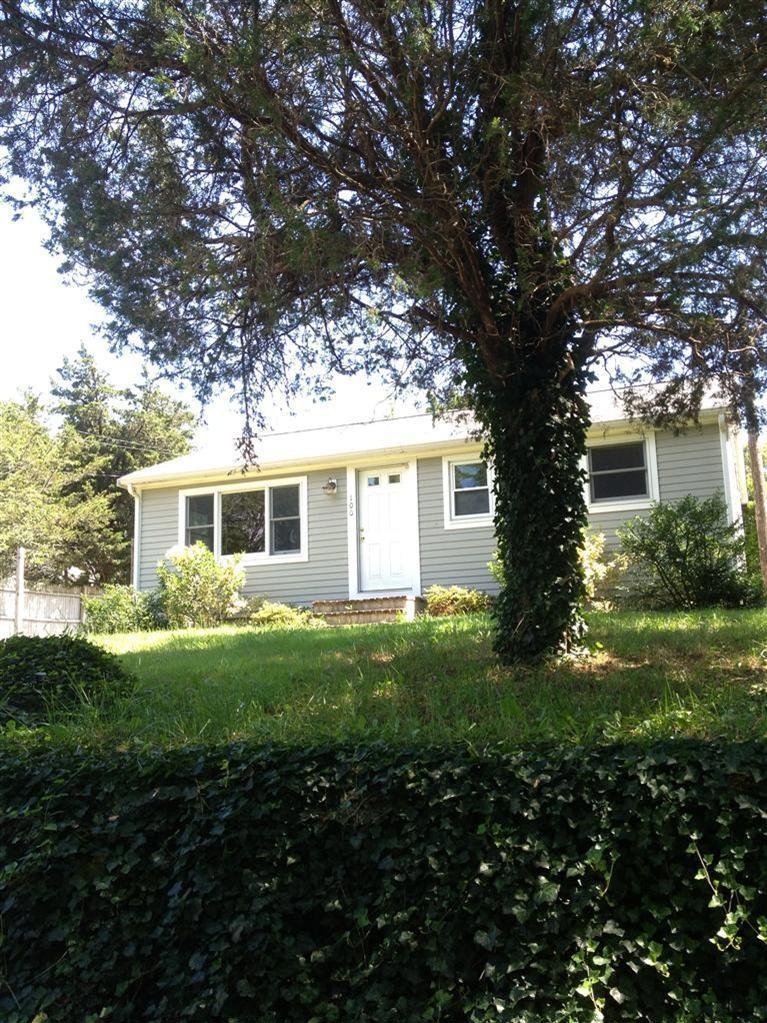
100 Dumont Dr Hyannis, MA 02601
Hyannis NeighborhoodHighlights
- Medical Services
- No HOA
- Patio
- Wood Flooring
- Linen Closet
- Living Room
About This Home
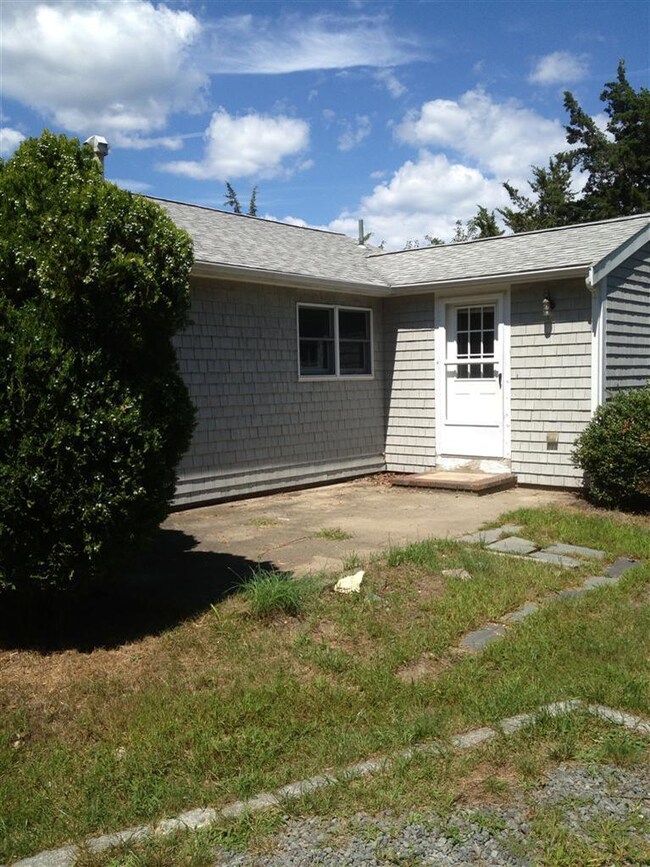
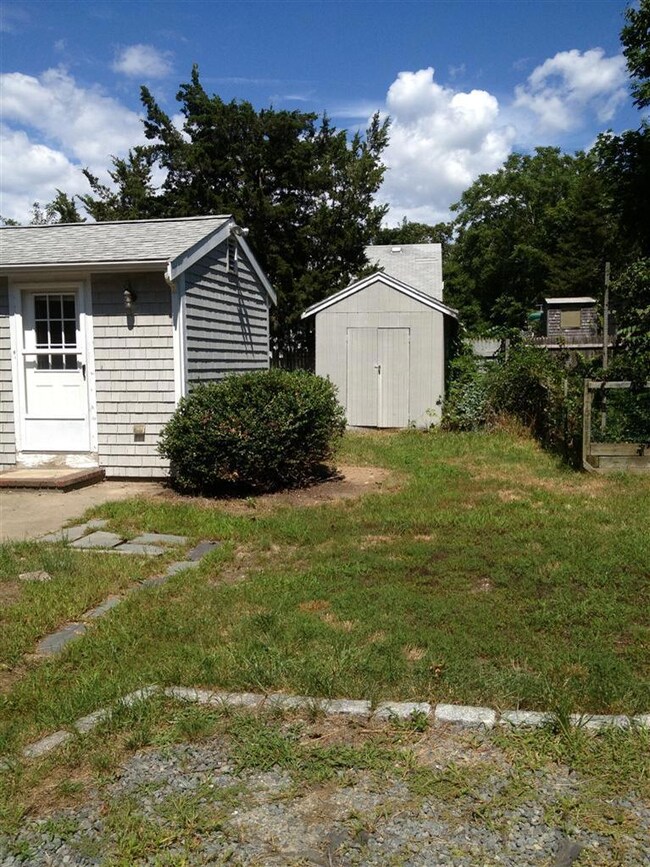
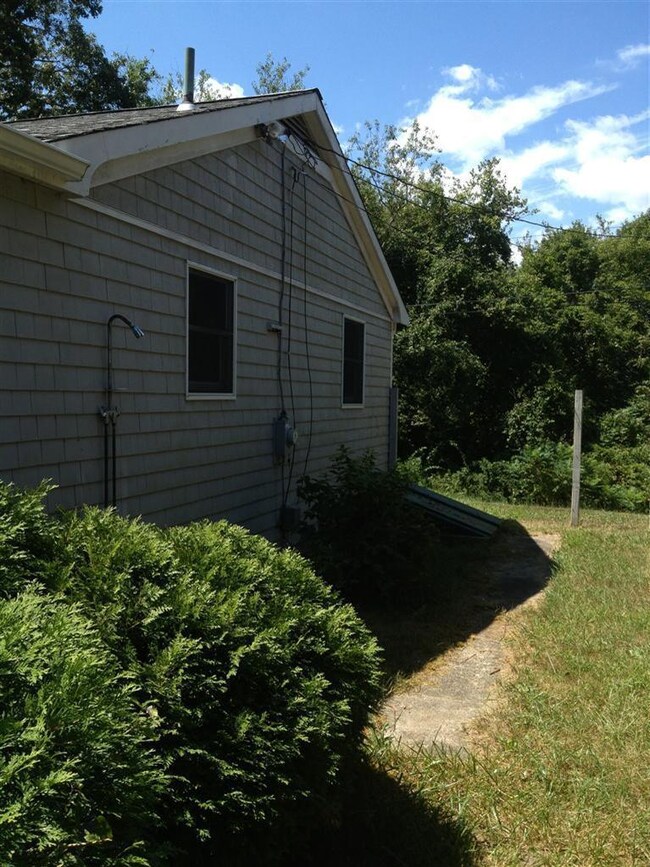
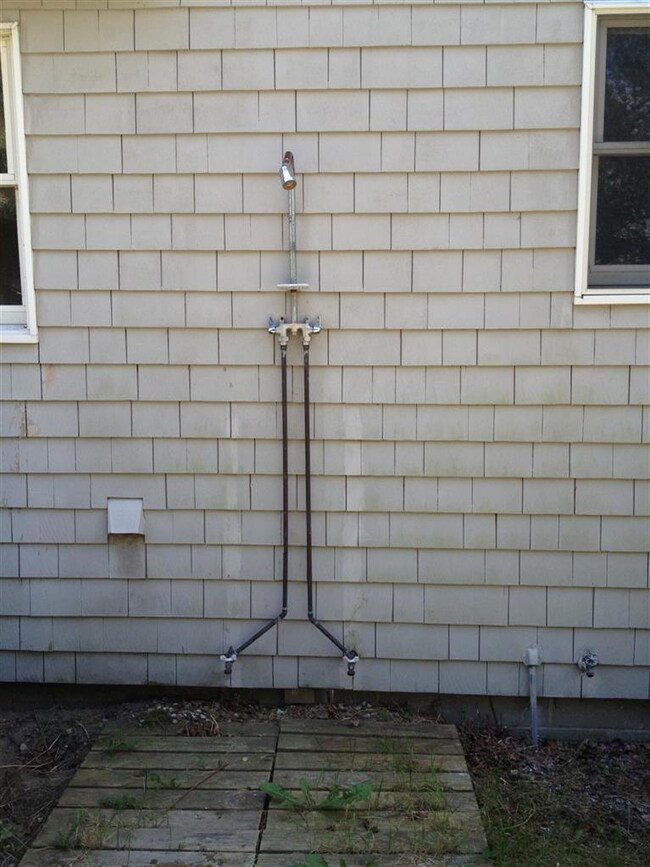
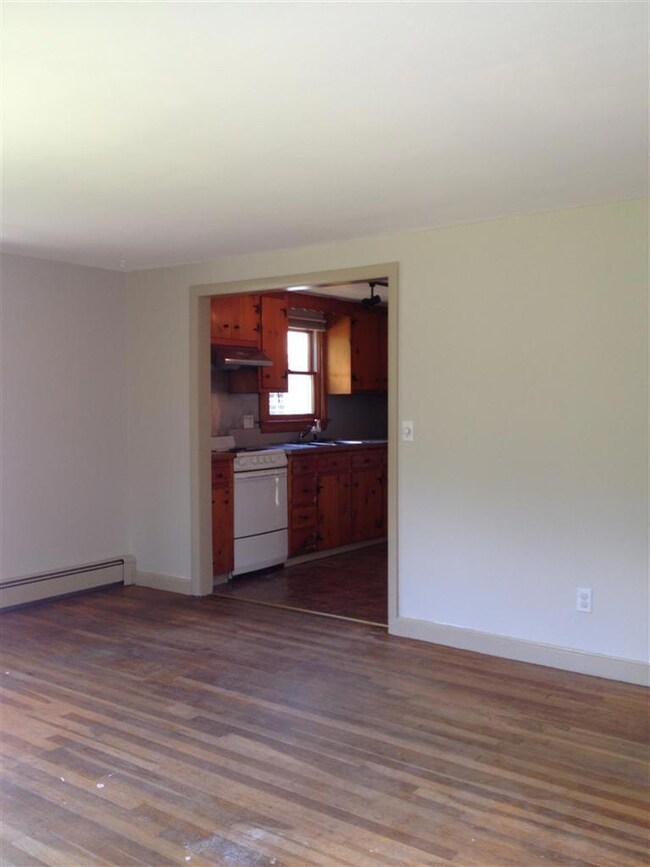
As of February 2024REDUCED to $195,000. WHY???...The owners want an offer today & are willing to negotiate.At this price they are offering a credit of $7500 at closing for the town betterment of approximately $7500 for the fact that there is town sewer hook-up. This is a Decent home with updated bath, new sink & floor.Three bedrooms, w/closets & hardwood throughout- OK,they could be refinished but they are great floors...kitchen needs a some elbow grease as does the mudroom but for $195k you get a quiet location & walk to downtown Hyannis & Anderson windows & newer roof & gas heat & full basement & attic, yard & shed & an outdoor shower.Come see today
Last Agent to Sell the Property
Marirose Lynch
RE/MAX Spectrum
Last Buyer's Agent
Danny Griffin
Realty Executives I
Home Details
Home Type
- Single Family
Est. Annual Taxes
- $1,652
Year Built
- Built in 1962
Lot Details
- 0.26 Acre Lot
- Street terminates at a dead end
- Gentle Sloping Lot
- Cleared Lot
- Garden
- Yard
Home Design
- Block Foundation
- Pitched Roof
- Asphalt Roof
- Shingle Siding
- Clapboard
Interior Spaces
- 878 Sq Ft Home
- 1-Story Property
- Living Room
- Basement Fills Entire Space Under The House
Flooring
- Wood
- Vinyl
Bedrooms and Bathrooms
- 3 Bedrooms
- Linen Closet
- 1 Full Bathroom
Laundry
- Laundry Room
- Laundry on main level
Outdoor Features
- Outdoor Shower
- Patio
- Outbuilding
Location
- Property is near place of worship
- Property is near shops
- Property is near a golf course
Utilities
- Hot Water Heating System
- Gas Water Heater
Community Details
- No Home Owners Association
- Medical Services
Listing and Financial Details
- Assessor Parcel Number 307092
Ownership History
Purchase Details
Purchase Details
Home Financials for this Owner
Home Financials are based on the most recent Mortgage that was taken out on this home.Map
Home Values in the Area
Average Home Value in this Area
Purchase History
| Date | Type | Sale Price | Title Company |
|---|---|---|---|
| Quit Claim Deed | -- | -- | |
| Deed | $268,000 | -- |
Mortgage History
| Date | Status | Loan Amount | Loan Type |
|---|---|---|---|
| Open | $414,356 | FHA | |
| Closed | $487,500 | Reverse Mortgage Home Equity Conversion Mortgage | |
| Previous Owner | $214,400 | Purchase Money Mortgage | |
| Previous Owner | $40,200 | No Value Available | |
| Previous Owner | $81,518 | No Value Available | |
| Previous Owner | $85,600 | No Value Available |
Property History
| Date | Event | Price | Change | Sq Ft Price |
|---|---|---|---|---|
| 02/28/2024 02/28/24 | Sold | $422,000 | -0.7% | $481 / Sq Ft |
| 12/26/2023 12/26/23 | Pending | -- | -- | -- |
| 12/13/2023 12/13/23 | For Sale | $425,000 | 0.0% | $484 / Sq Ft |
| 12/11/2023 12/11/23 | Pending | -- | -- | -- |
| 12/06/2023 12/06/23 | Price Changed | $425,000 | -3.4% | $484 / Sq Ft |
| 12/06/2023 12/06/23 | Price Changed | $439,900 | -2.2% | $501 / Sq Ft |
| 12/06/2023 12/06/23 | For Sale | $449,900 | 0.0% | $512 / Sq Ft |
| 12/01/2023 12/01/23 | Pending | -- | -- | -- |
| 11/27/2023 11/27/23 | Price Changed | $449,900 | -5.3% | $512 / Sq Ft |
| 10/31/2023 10/31/23 | For Sale | $475,000 | +156.8% | $541 / Sq Ft |
| 09/15/2014 09/15/14 | Sold | $185,000 | 0.0% | $211 / Sq Ft |
| 09/15/2014 09/15/14 | Sold | $185,000 | -11.5% | $211 / Sq Ft |
| 09/15/2014 09/15/14 | Pending | -- | -- | -- |
| 09/15/2014 09/15/14 | For Sale | $209,000 | -8.7% | $238 / Sq Ft |
| 09/05/2014 09/05/14 | Pending | -- | -- | -- |
| 08/07/2013 08/07/13 | For Sale | $229,000 | -- | $261 / Sq Ft |
Tax History
| Year | Tax Paid | Tax Assessment Tax Assessment Total Assessment is a certain percentage of the fair market value that is determined by local assessors to be the total taxable value of land and additions on the property. | Land | Improvement |
|---|---|---|---|---|
| 2025 | $3,428 | $369,800 | $149,300 | $220,500 |
| 2024 | $3,329 | $367,900 | $149,300 | $218,600 |
| 2023 | $3,089 | $322,800 | $135,700 | $187,100 |
| 2022 | $3,044 | $263,100 | $100,500 | $162,600 |
| 2021 | $2,774 | $232,900 | $100,500 | $132,400 |
| 2020 | $2,789 | $226,200 | $100,500 | $125,700 |
| 2019 | $2,641 | $209,900 | $100,500 | $109,400 |
| 2018 | $2,421 | $196,800 | $105,800 | $91,000 |
| 2017 | $2,308 | $192,500 | $105,800 | $86,700 |
| 2016 | $2,266 | $193,200 | $106,500 | $86,700 |
| 2015 | $2,182 | $188,600 | $102,400 | $86,200 |
Source: Cape Cod & Islands Association of REALTORS®
MLS Number: 21307576
APN: HYAN-000307-000000-000092
Disclaimer: Certain information contained herein is derived from information provided by parties other than Homes.com. All information provided is deemed reliable, but is not guaranteed to be accurate and should be independently verified.
![]() All data relating to real estate for sale on this page comes from the Broker Reciprocity (BR) of the Cape Cod & Islands Multiple Listing Service, Inc. Detailed information about real estate listings held by brokerage firms other than CC&I Assoc. of REALTORS®, Inc. includes the name of the listing company. Neither the listing company nor CC&I Assoc. of REALTORS®, Inc. shall be responsible for any typographical errors, misinformation, misprints and shall be held totally harmless. The Broker providing this data believes it to be correct, but advises interested parties to confirm any item before relying on it in a purchase decision. All properties are subject to prior sale, changes, or withdrawal. Copyright 2025 © Cape Cod & Islands Multiple Listing Service, Inc. All rights reserved.
All data relating to real estate for sale on this page comes from the Broker Reciprocity (BR) of the Cape Cod & Islands Multiple Listing Service, Inc. Detailed information about real estate listings held by brokerage firms other than CC&I Assoc. of REALTORS®, Inc. includes the name of the listing company. Neither the listing company nor CC&I Assoc. of REALTORS®, Inc. shall be responsible for any typographical errors, misinformation, misprints and shall be held totally harmless. The Broker providing this data believes it to be correct, but advises interested parties to confirm any item before relying on it in a purchase decision. All properties are subject to prior sale, changes, or withdrawal. Copyright 2025 © Cape Cod & Islands Multiple Listing Service, Inc. All rights reserved.
- 187 Sea St
- 86 Seabrook Rd
- 39 Alden Way
- 30 Alden Way
- 15 Oak Neck Rd Unit 11
- 15 Oak Neck Rd Unit 2 (12)
- 51 Chase St
- 574 Main St
- 31 Arbor Way
- 34 Crocker Dr
- 230 Gosnold St Unit 11A-11B-11C
- 230 Gosnold St Unit 11ABC
- 110 W Main St Unit 30
- 49 Snow Creek Dr
- 194 Old Colony Rd
- 155 Mitchell Ln
- 155 Mitchells Way
- 169 Gosnold St
- 113 Briarwood Ave
- 6 Harrington Way