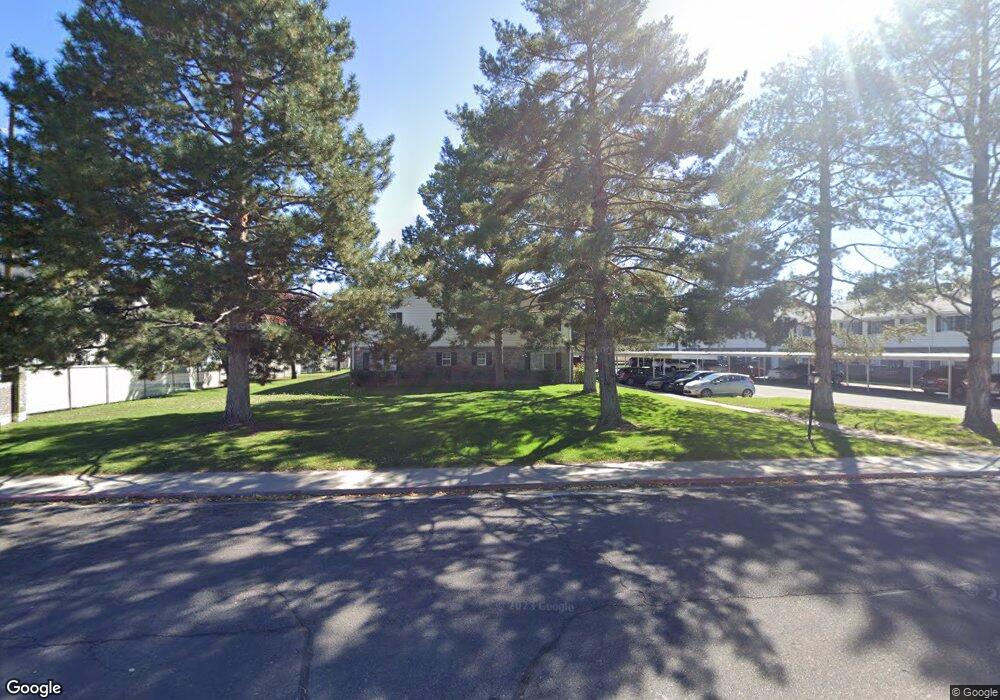
100 E 600 S Orem, UT 84058
Orem South NeighborhoodEstimated Value: $249,000 - $304,000
2
Beds
1
Bath
825
Sq Ft
$328/Sq Ft
Est. Value
About This Home
This home is located at 100 E 600 S, Orem, UT 84058 and is currently estimated at $270,780, approximately $328 per square foot. 100 E 600 S is a home located in Utah County with nearby schools including Westmore Elementary School, Lakeridge Jr High School, and Mountain View High School.
Ownership History
Date
Name
Owned For
Owner Type
Purchase Details
Closed on
Jul 28, 2021
Sold by
Schramm Family Holdings Llc
Bought by
Gibson Stephen and Coombs Alexi
Current Estimated Value
Home Financials for this Owner
Home Financials are based on the most recent Mortgage that was taken out on this home.
Original Mortgage
$199,405
Outstanding Balance
$181,321
Interest Rate
2.9%
Mortgage Type
New Conventional
Estimated Equity
$89,459
Purchase Details
Closed on
Mar 9, 2007
Sold by
Schramm Steven R and Schramm Marcia A
Bought by
Schramm Family Holdings Llc
Purchase Details
Closed on
Jul 8, 2002
Sold by
Masuda Donna S and Siu Susan K I
Bought by
Schramm Steven R and Schramm Marcia A
Create a Home Valuation Report for This Property
The Home Valuation Report is an in-depth analysis detailing your home's value as well as a comparison with similar homes in the area
Home Values in the Area
Average Home Value in this Area
Purchase History
| Date | Buyer | Sale Price | Title Company |
|---|---|---|---|
| Gibson Stephen | -- | United West Title | |
| Schramm Family Holdings Llc | -- | None Available | |
| Schramm Family Holdings Llc | -- | None Available | |
| Schramm Steven R | -- | Century Title | |
| Schramm Steven R | -- | Century Title |
Source: Public Records
Mortgage History
| Date | Status | Borrower | Loan Amount |
|---|---|---|---|
| Open | Gibson Stephen | $199,405 |
Source: Public Records
Tax History
| Year | Tax Paid | Tax Assessment Tax Assessment Total Assessment is a certain percentage of the fair market value that is determined by local assessors to be the total taxable value of land and additions on the property. | Land | Improvement |
|---|---|---|---|---|
| 2025 | $1,062 | $135,025 | -- | -- |
| 2024 | $1,062 | $129,855 | $0 | $0 |
| 2023 | $1,004 | $131,945 | $0 | $0 |
| 2022 | $908 | $115,610 | $0 | $0 |
| 2021 | $855 | $164,900 | $19,800 | $145,100 |
| 2020 | $777 | $147,200 | $17,700 | $129,500 |
| 2019 | $718 | $141,500 | $17,500 | $124,000 |
| 2018 | $653 | $123,000 | $15,500 | $107,500 |
| 2017 | $608 | $61,380 | $0 | $0 |
| 2016 | $572 | $53,185 | $0 | $0 |
| 2015 | $581 | $51,150 | $0 | $0 |
| 2014 | $534 | $46,750 | $0 | $0 |
Source: Public Records
Map
Nearby Homes
- 100 E 600 S
- 100 E 600 S
- 100 E 600 S
- 100 E 600 S
- 100 E 600 S Unit 11
- 100 E 600 S
- 100 E 600 S
- 100 E 600 S
- 100 E 600 S
- 100 E 600 S Unit 6
- 100 E 600 S
- 100 E 600 S Unit 3
- 100 E 600 S Unit 4
- 100 E 600 S Unit 2
- 100 E 600 S
- 100 E 600 S Unit 8
- 100 E 600 S Unit 7
- 100 E 600 S Unit 10
- 100 E 600 S Unit 9
- 100 E 600 S Unit 1
Your Personal Tour Guide
Ask me questions while you tour the home.