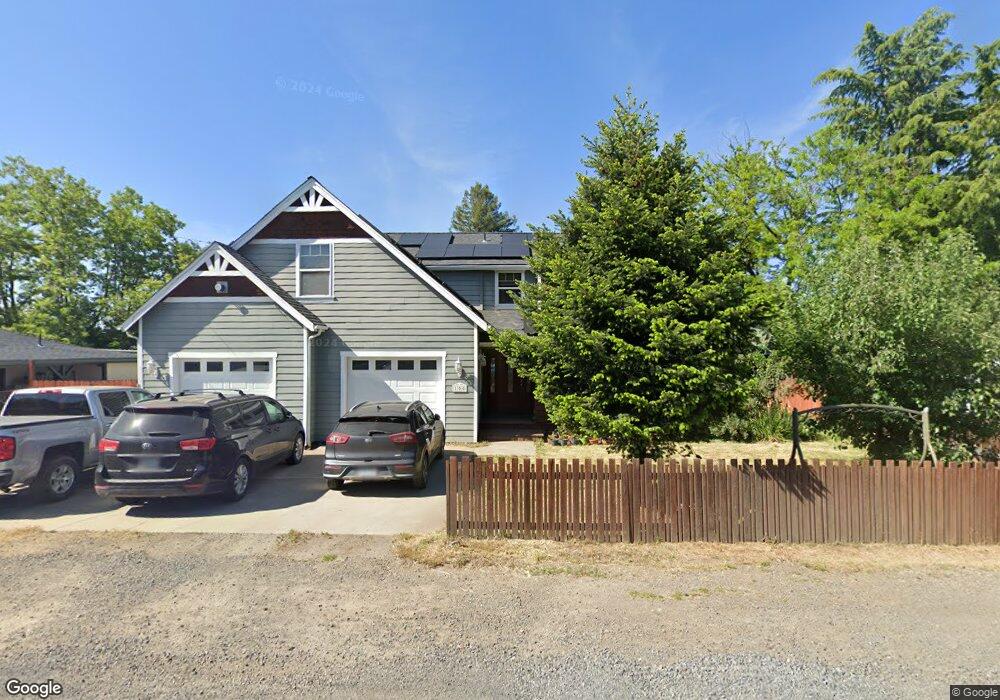
100 Foss Rd Talent, OR 97540
Estimated Value: $538,000 - $923,000
5
Beds
4
Baths
2,887
Sq Ft
$248/Sq Ft
Est. Value
About This Home
This home is located at 100 Foss Rd, Talent, OR 97540 and is currently estimated at $717,351, approximately $248 per square foot. 100 Foss Rd is a home with nearby schools including Talent Elementary School, Talent Middle School, and Phoenix High School.
Ownership History
Date
Name
Owned For
Owner Type
Purchase Details
Closed on
Sep 27, 2006
Sold by
Mcintosh Christopher R
Bought by
Walker Eric T and Walker Ayako
Current Estimated Value
Home Financials for this Owner
Home Financials are based on the most recent Mortgage that was taken out on this home.
Original Mortgage
$413,000
Outstanding Balance
$263,530
Interest Rate
7.75%
Mortgage Type
New Conventional
Estimated Equity
$453,821
Purchase Details
Closed on
Jun 29, 2004
Sold by
Mcintosh Richard U and Mcintosh Marilyn R
Bought by
Mcintosh Christopher R
Purchase Details
Closed on
Oct 30, 2003
Sold by
Jarvi Dennis E and Jarvi Julie A
Bought by
Mcintosh Richard U and Mcintosh Marilyn R
Create a Home Valuation Report for This Property
The Home Valuation Report is an in-depth analysis detailing your home's value as well as a comparison with similar homes in the area
Home Values in the Area
Average Home Value in this Area
Purchase History
| Date | Buyer | Sale Price | Title Company |
|---|---|---|---|
| Walker Eric T | $464,000 | First American Title Insuran | |
| Mcintosh Christopher R | $228,899 | First American Title | |
| Mcintosh Richard U | $65,000 | Amerititle |
Source: Public Records
Mortgage History
| Date | Status | Borrower | Loan Amount |
|---|---|---|---|
| Open | Walker Eric T | $413,000 |
Source: Public Records
Tax History Compared to Growth
Tax History
| Year | Tax Paid | Tax Assessment Tax Assessment Total Assessment is a certain percentage of the fair market value that is determined by local assessors to be the total taxable value of land and additions on the property. | Land | Improvement |
|---|---|---|---|---|
| 2025 | $6,076 | $388,700 | $66,450 | $322,250 |
| 2024 | $6,076 | $377,380 | $64,520 | $312,860 |
| 2023 | $5,886 | $366,390 | $62,640 | $303,750 |
| 2022 | $5,730 | $366,390 | $62,640 | $303,750 |
| 2021 | $5,676 | $355,720 | $60,820 | $294,900 |
| 2020 | $5,501 | $345,360 | $59,050 | $286,310 |
| 2019 | $5,354 | $325,550 | $55,660 | $269,890 |
| 2018 | $5,636 | $316,070 | $54,040 | $262,030 |
| 2017 | $5,333 | $316,070 | $54,040 | $262,030 |
| 2016 | $5,169 | $297,940 | $50,940 | $247,000 |
| 2015 | $4,964 | $297,940 | $50,940 | $247,000 |
| 2014 | $4,766 | $280,850 | $48,020 | $232,830 |
Source: Public Records
Map
Nearby Homes
- 0 Wagner Gap Rd Unit 697062504
- 106 N 1st St
- 539 James St
- 169 Wagner Butte Ave
- 355 Colver Rd Unit 27
- 6493 Colver Rd
- 233 Wintersage Cir
- 0 Tl3300 Suncrest Rd
- 414 Wintersage
- 268 S Pacific Hwy
- 312 E Rapp Rd
- 0 Suncrest Rd Unit 220198669
- 0 Foss Rd Unit 1500 220195454
- 311 S Pacific Hwy
- 100 Oak Valley Dr
- 115 Oak Valley Dr
- 303 Everett Way
- 300 Oak Valley Dr
- 1720 Talent Ave
- 60 Talent Ave