100 Harding St Elgin, IL 60123
Southwest Elgin NeighborhoodEstimated Value: $224,000 - $247,000
About This Home
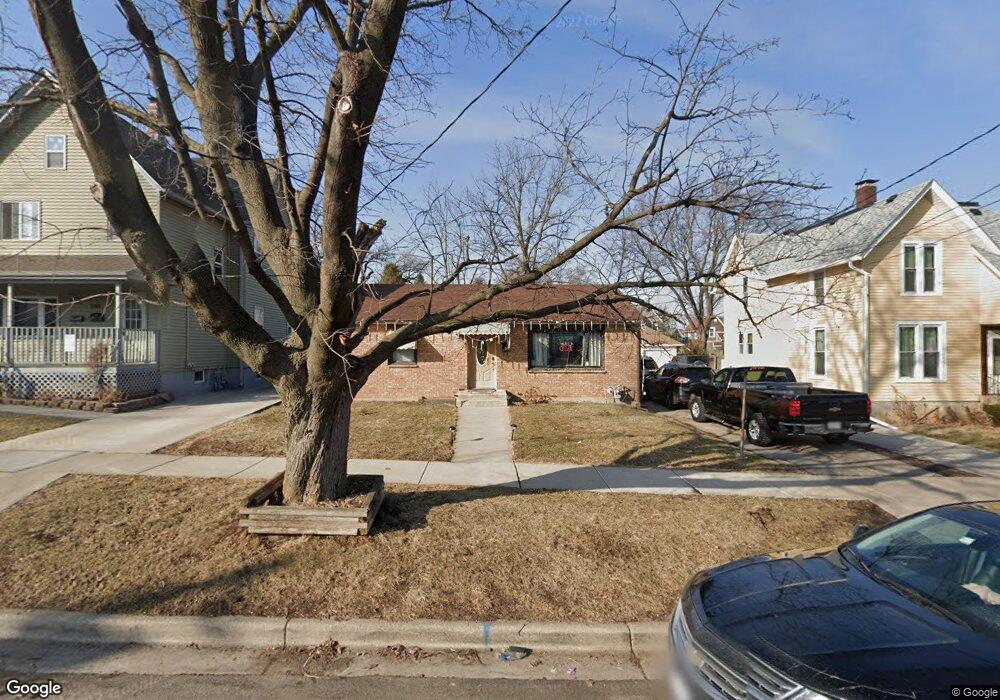
This home is located at 100 Harding St, Elgin, IL 60123 and is currently estimated at $235,330, approximately $268 per square foot. 100 Harding St is a home located in Kane County with nearby schools including Lowrie Elementary School, Abbott Middle School, and Larkin High School.
Ownership History
We collect this data history from publicly available records. To have your information removed, we recommend requesting removal directly through your county’s website.
Purchase Details
Home Financials for this Owner
Home Financials are based on the most recent Mortgage that was taken out on this home.Purchase Details
Home Financials for this Owner
Home Financials are based on the most recent Mortgage that was taken out on this home.Home Values in the Area
Average Home Value in this Area
Purchase History
We collect this data history from publicly available records. To have your information removed, we recommend requesting removal directly through your county’s website.
| Date | Buyer | Sale Price | Title Company |
|---|---|---|---|
| -- | Law Title Joliet | ||
| $106,500 | -- |
Mortgage History
We collect this data history from publicly available records. To have your information removed, we recommend requesting removal directly through your county’s website.
| Date | Status | Borrower | Loan Amount |
|---|---|---|---|
| Open | $165,750 | ||
| Closed | $101,150 |
Tax History
We collect this data history from publicly available records. To have your information removed, we recommend requesting removal directly through your county’s website.
| Year | Tax Paid | Tax Assessment Tax Assessment Total Assessment is a certain percentage of the fair market value that is determined by local assessors to be the total taxable value of land and additions on the property. | Land | Improvement |
|---|---|---|---|---|
| 2024 | $4,200 | $60,476 | $14,199 | $46,277 |
| 2023 | $3,976 | $54,636 | $12,828 | $41,808 |
| 2022 | $3,800 | $49,819 | $11,697 | $38,122 |
| 2021 | $3,620 | $46,577 | $10,936 | $35,641 |
| 2020 | $3,508 | $44,465 | $10,440 | $34,025 |
| 2019 | $3,396 | $42,356 | $9,945 | $32,411 |
| 2018 | $3,352 | $39,902 | $9,369 | $30,533 |
| 2017 | $3,263 | $37,722 | $8,857 | $28,865 |
| 2016 | $3,092 | $34,996 | $8,217 | $26,779 |
| 2015 | -- | $32,077 | $7,532 | $24,545 |
| 2014 | -- | $31,681 | $7,439 | $24,242 |
| 2013 | -- | $32,516 | $7,635 | $24,881 |
Map
- 214 S State St
- 255 Bartlett Place
- 410 Standish St
- 515 Oak St
- 217 Michigan St
- 161 S Grove Ave
- 153 Dawson Dr
- 515 Walnut Ave
- 142 Dawson Dr
- 132 Dawson Dr
- 131 Dawson Dr
- 571 Walnut Ave
- 433 Arlington Ave
- 618 Washburn St
- 468 Locust St
- 555 S Liberty St
- 662 Bent St
- 720 Adams St
- Lot 3 Russell St
- 415 Russell St
Ask me questions while you tour the home.