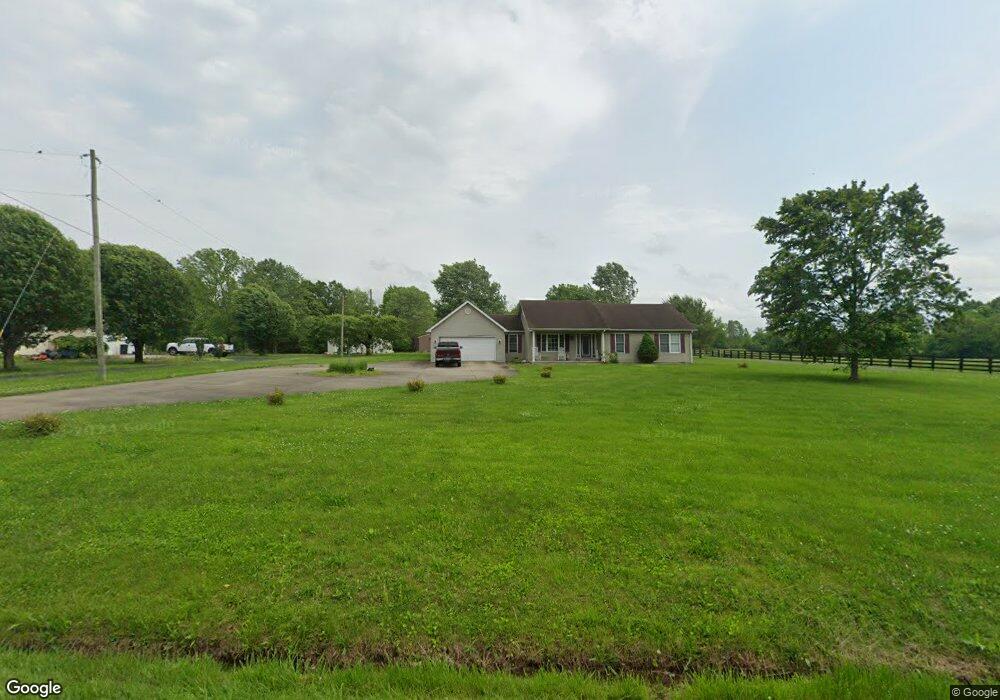
100 Hazy Downs Rd Raywick, KY 40060
Estimated Value: $191,585 - $261,000
3
Beds
2
Baths
1,611
Sq Ft
$140/Sq Ft
Est. Value
About This Home
This home is located at 100 Hazy Downs Rd, Raywick, KY 40060 and is currently estimated at $225,646, approximately $140 per square foot. 100 Hazy Downs Rd is a home located in Marion County with nearby schools including Marion County High School.
Ownership History
Date
Name
Owned For
Owner Type
Purchase Details
Closed on
Jul 3, 2014
Sold by
Secretary Of Veterans Affairs
Bought by
Looft Stephen R
Current Estimated Value
Purchase Details
Closed on
Oct 30, 2009
Sold by
Looft Steve and Sapp Brenda
Bought by
Looft Stephen and Sapp Brenda
Home Financials for this Owner
Home Financials are based on the most recent Mortgage that was taken out on this home.
Original Mortgage
$138,380
Interest Rate
4.93%
Purchase Details
Closed on
Mar 23, 2009
Sold by
Looft Steve
Bought by
Looft Steve and Sapp Brenda
Purchase Details
Closed on
Oct 20, 2008
Sold by
Sapp Brenda
Bought by
Looft Steve
Purchase Details
Closed on
May 27, 2008
Sold by
Miles Donald L and Miles Pamela R
Bought by
Sapp Brenda and Looft Steve
Home Financials for this Owner
Home Financials are based on the most recent Mortgage that was taken out on this home.
Original Mortgage
$123,600
Interest Rate
6.02%
Mortgage Type
FHA
Create a Home Valuation Report for This Property
The Home Valuation Report is an in-depth analysis detailing your home's value as well as a comparison with similar homes in the area
Purchase History
| Date | Buyer | Sale Price | Title Company |
|---|---|---|---|
| Looft Stephen R | $12,500 | None Available | |
| Looft Stephen | -- | -- | |
| Looft Steve | -- | None Available | |
| Looft Steve | -- | -- | |
| Looft Steve | -- | -- | |
| Sapp Brenda | -- | None Available |
Source: Public Records
Mortgage History
| Date | Status | Borrower | Loan Amount |
|---|---|---|---|
| Previous Owner | Looft Stephen | $138,380 | |
| Previous Owner | Sapp Brenda | $123,600 |
Source: Public Records
Tax History
| Year | Tax Paid | Tax Assessment Tax Assessment Total Assessment is a certain percentage of the fair market value that is determined by local assessors to be the total taxable value of land and additions on the property. | Land | Improvement |
|---|---|---|---|---|
| 2025 | $888 | $150,000 | $150,000 | $0 |
| 2024 | $1,154 | $130,000 | $130,000 | $0 |
| 2023 | $1,166 | $130,000 | $130,000 | $0 |
| 2022 | $1,175 | $130,000 | $130,000 | $0 |
| 2021 | $1,196 | $130,000 | $130,000 | $0 |
| 2020 | $973 | $105,000 | $105,000 | $0 |
| 2019 | $973 | $105,000 | $105,000 | $0 |
| 2018 | $983 | $105,000 | $105,000 | $0 |
| 2017 | $982 | $105,000 | $105,000 | $0 |
| 2015 | $928 | $105,000 | $105,000 | $0 |
| 2012 | $899 | $105,000 | $105,000 | $0 |
Source: Public Records
Map
Nearby Homes
- 90 Hazy Downs Rd
- 45 Cambron Ln
- 36 Ed Cecil Rd
- 2258 Mccauley Rd
- 4126 Scotts Ridge Rd
- 250 Green Hollow Rd
- 3525 Saint Marys Rd
- 129 Scenic Hill Dr
- 275 Windy Ln
- 84 Drew Ln
- 8880 N Loretto Rd
- 8935 N Loretto Rd
- 125 Gabes Ln
- 4983 Kentucky 52
- 7179 Saint Joe Rd
- 8675 Kentucky 52
- 8743 Kentucky 52
- 4415 N Loretto Rd
- 2143 Mount Gilboa Rd
- 64 Falcon Crest
- 190 Hazy Downs Rd
- 140 Hazy Downs Rd
- 205 Hazy Downs Rd
- 210 Hazy Downs Rd
- 251 Hazy Downs Rd
- 175 Hazy Downs Rd
- 105 Hazy Downs Rd
- 76 Cambron Ln
- 90 Cambron Ln
- 115 Cambron Ln
- 40 Cambron Ln
- 5815 Raywick Rd
- 30 Cambron Ln
- 90 Je Bickett Rd
- 5440 Raywick Rd
- 5450 Raywick Rd
- 5530 Raywick Rd
- 5430 Raywick Rd
- 35 Je Bickett Rd
- 405 Hazy Downs Rd
Your Personal Tour Guide
Ask me questions while you tour the home.