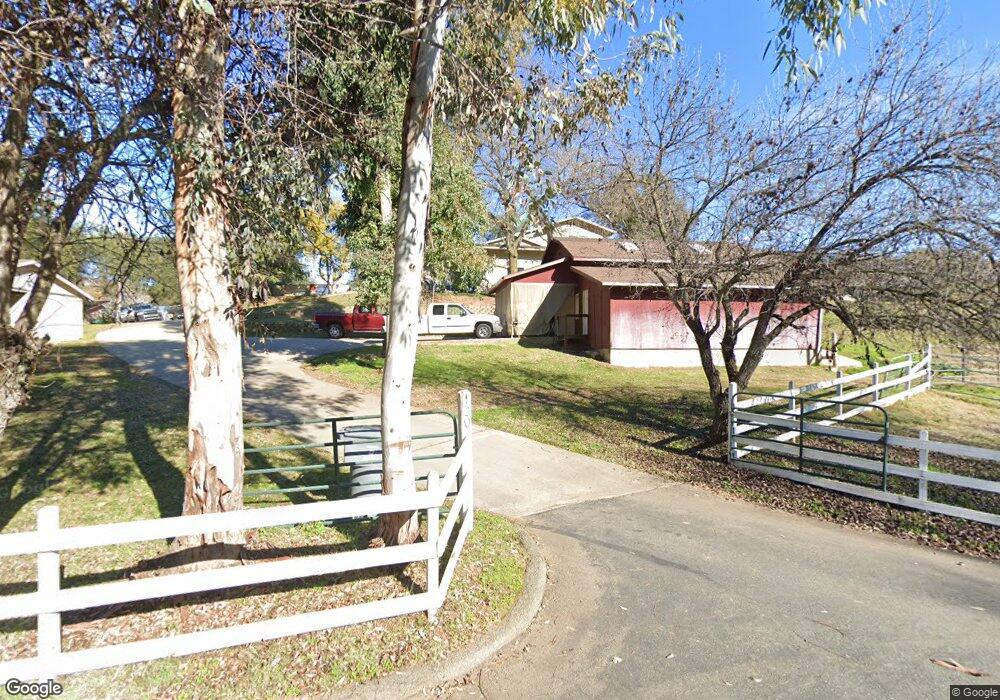
100 Hidden Acres Ln Newcastle, CA 95658
Estimated Value: $742,000 - $991,135
4
Beds
3
Baths
2,632
Sq Ft
$338/Sq Ft
Est. Value
About This Home
This home is located at 100 Hidden Acres Ln, Newcastle, CA 95658 and is currently estimated at $888,378, approximately $337 per square foot. 100 Hidden Acres Ln is a home located in Placer County with nearby schools including Carlin C. Coppin Elementary, Glen Edwards Middle, and Lincoln High.
Ownership History
Date
Name
Owned For
Owner Type
Purchase Details
Closed on
May 16, 2024
Sold by
Jones Johnnie and Jones Regina
Bought by
Johnnie David Jones And Regina Gail Jones Fam and Jones
Current Estimated Value
Purchase Details
Closed on
Mar 22, 2013
Sold by
Jones Johnnie D and Jones Regina G
Bought by
Jones Regina and Jones Johnnie
Home Financials for this Owner
Home Financials are based on the most recent Mortgage that was taken out on this home.
Original Mortgage
$266,000
Interest Rate
3.54%
Mortgage Type
New Conventional
Purchase Details
Closed on
Jun 10, 1997
Sold by
Costello John M and Costello Joan M
Bought by
Jones Johnnie D and Jones Regina G
Home Financials for this Owner
Home Financials are based on the most recent Mortgage that was taken out on this home.
Original Mortgage
$172,000
Interest Rate
7.94%
Mortgage Type
Purchase Money Mortgage
Create a Home Valuation Report for This Property
The Home Valuation Report is an in-depth analysis detailing your home's value as well as a comparison with similar homes in the area
Home Values in the Area
Average Home Value in this Area
Purchase History
| Date | Buyer | Sale Price | Title Company |
|---|---|---|---|
| Johnnie David Jones And Regina Gail Jones Fam | -- | None Listed On Document | |
| Jones Regina | -- | None Available | |
| Jones Johnnie D | $215,000 | Old Republic Title Company |
Source: Public Records
Mortgage History
| Date | Status | Borrower | Loan Amount |
|---|---|---|---|
| Previous Owner | Jones Regina | $266,000 | |
| Previous Owner | Jones Johnnie D | $172,000 |
Source: Public Records
Tax History Compared to Growth
Tax History
| Year | Tax Paid | Tax Assessment Tax Assessment Total Assessment is a certain percentage of the fair market value that is determined by local assessors to be the total taxable value of land and additions on the property. | Land | Improvement |
|---|---|---|---|---|
| 2025 | $4,943 | $473,658 | $146,566 | $327,092 |
| 2023 | $4,943 | $455,268 | $140,876 | $314,392 |
| 2022 | $4,797 | $446,342 | $138,114 | $308,228 |
| 2021 | $4,702 | $437,591 | $135,406 | $302,185 |
| 2020 | $4,675 | $433,105 | $134,018 | $299,087 |
| 2019 | $4,552 | $424,614 | $131,391 | $293,223 |
| 2018 | $4,439 | $416,289 | $128,815 | $287,474 |
| 2017 | $4,297 | $408,128 | $126,290 | $281,838 |
| 2016 | $4,193 | $400,126 | $123,814 | $276,312 |
| 2015 | $4,100 | $394,117 | $121,955 | $272,162 |
| 2014 | $3,993 | $386,398 | $119,567 | $266,831 |
Source: Public Records
Map
Nearby Homes
- 405 Oak View Rd
- 590 Columbia Dam Rd
- 5520 Virginiatown Rd
- 460 Gold Hill Rd
- 6540 Virginiatown Rd Unit 5
- 0 Chili Hill Rd
- 0 Whittington Dr Unit 223000301
- 1200 Gold Hill Rd
- 60 Whittington Dr
- 6705 Ravine Ct
- 6990 Chili Hill Rd
- 7293 Ridge Rd
- 300 Dutch Ravine Ln
- 7380 Ridge Rd
- 731 Janet Ct
- 4700 Club Vista Way
- 4690 Club Vista Way
- 4761 Starglow Dr
- 150 Spring Ln
- 4788 Starglow Dr
- 6015 State Highway 193
- 6015 State Highway 193
- 240 Hidden Acres Ln
- 6023 State Highway 193
- 290 Hidden Acres Ln
- 5875 Sycamore Hill Rd
- 605 Mandarin Hill Ct
- 6040 Sycamore Hill Rd
- 6015 Sycamore Hill Rd
- 340 Hidden Acres Ln
- 0 Mandarin Hill Rd
- 6045 Sycamore Hill Rd
- 0 Hidden Acres Ln
- 431 Hidden Acres Ln
- 430 Hidden Acres Ln
- 150 Mandarin Hill Rd
- 660 Mandarin Hill Ct
- 5897 Sycamore Hill Rd
- 210 Mandarin Hill Rd
- 434 Hidden Acres Ln