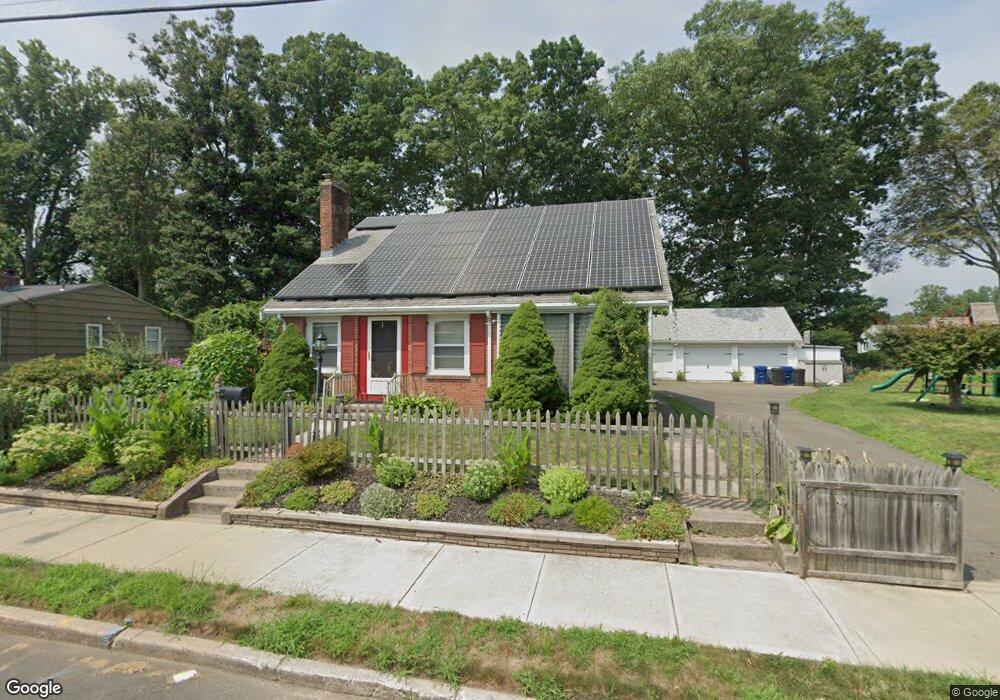
100 Holcomb St West Haven, CT 06516
West Shore NeighborhoodEstimated Value: $461,000 - $481,742
3
Beds
2
Baths
1,744
Sq Ft
$271/Sq Ft
Est. Value
About This Home
This home is located at 100 Holcomb St, West Haven, CT 06516 and is currently estimated at $472,936, approximately $271 per square foot. 100 Holcomb St is a home located in New Haven County with nearby schools including Carrigan 5/6 Intermediate School, Harry M. Bailey Middle School, and West Haven High School.
Ownership History
Date
Name
Owned For
Owner Type
Purchase Details
Closed on
Oct 6, 1999
Sold by
Schwartz Patricia A
Bought by
Bisceglia Antonio and Bisceglia Concetta
Current Estimated Value
Purchase Details
Closed on
Oct 19, 1992
Sold by
Camp Dorothy
Bought by
Schwartz Patricia A and Schwartz Mark J
Create a Home Valuation Report for This Property
The Home Valuation Report is an in-depth analysis detailing your home's value as well as a comparison with similar homes in the area
Home Values in the Area
Average Home Value in this Area
Purchase History
| Date | Buyer | Sale Price | Title Company |
|---|---|---|---|
| Bisceglia Antonio | $142,500 | -- | |
| Schwartz Patricia A | $85,000 | -- | |
| Bisceglia Antonio | $142,500 | -- | |
| Schwartz Patricia A | $85,000 | -- |
Source: Public Records
Mortgage History
| Date | Status | Borrower | Loan Amount |
|---|---|---|---|
| Open | Schwartz Patricia A | $206,000 | |
| Closed | Schwartz Patricia A | $191,024 |
Source: Public Records
Tax History Compared to Growth
Tax History
| Year | Tax Paid | Tax Assessment Tax Assessment Total Assessment is a certain percentage of the fair market value that is determined by local assessors to be the total taxable value of land and additions on the property. | Land | Improvement |
|---|---|---|---|---|
| 2025 | $9,376 | $285,250 | $105,770 | $179,480 |
| 2024 | $8,155 | $174,020 | $74,410 | $99,610 |
| 2023 | $7,848 | $174,020 | $74,410 | $99,610 |
| 2022 | $7,707 | $174,020 | $74,410 | $99,610 |
| 2021 | $7,707 | $174,020 | $74,410 | $99,610 |
| 2020 | $7,676 | $157,920 | $70,070 | $87,850 |
| 2019 | $7,432 | $157,920 | $70,070 | $87,850 |
| 2018 | $7,326 | $157,920 | $70,070 | $87,850 |
| 2017 | $7,129 | $157,920 | $70,070 | $87,850 |
| 2016 | $7,049 | $157,920 | $70,070 | $87,850 |
| 2015 | $6,971 | $174,790 | $77,140 | $97,650 |
| 2014 | $6,971 | $174,790 | $77,140 | $97,650 |
Source: Public Records
Map
Nearby Homes