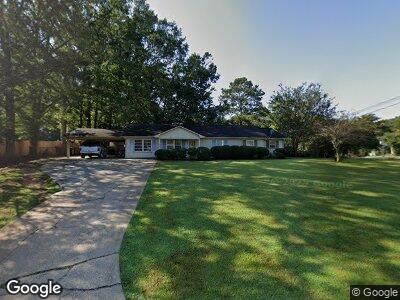
100 Huntington Cir Unit 3 Alpharetta, GA 30004
Estimated Value: $391,000 - $433,000
3
Beds
2
Baths
1,760
Sq Ft
$233/Sq Ft
Est. Value
About This Home
This home is located at 100 Huntington Cir Unit 3, Alpharetta, GA 30004 and is currently estimated at $410,107, approximately $233 per square foot. 100 Huntington Cir Unit 3 is a home located in Forsyth County with nearby schools including Brandywine Elementary School, DeSana Middle School, and Denmark High School.
Ownership History
Date
Name
Owned For
Owner Type
Purchase Details
Closed on
Jun 3, 2022
Sold by
Patel Ramesh M
Bought by
Patel Nayan K and Patel Sapana N
Current Estimated Value
Purchase Details
Closed on
Jun 30, 2005
Sold by
Hayes Royce
Bought by
Patel Nayan K and Patel Sapna
Home Financials for this Owner
Home Financials are based on the most recent Mortgage that was taken out on this home.
Original Mortgage
$161,405
Interest Rate
6.27%
Mortgage Type
New Conventional
Purchase Details
Closed on
May 21, 2004
Sold by
Galvin Hannan Mae
Bought by
Hayes Royce
Home Financials for this Owner
Home Financials are based on the most recent Mortgage that was taken out on this home.
Original Mortgage
$124,000
Interest Rate
5.89%
Mortgage Type
New Conventional
Purchase Details
Closed on
Apr 12, 2001
Sold by
Galvin Michael F
Bought by
Galvin Hannah Mae
Create a Home Valuation Report for This Property
The Home Valuation Report is an in-depth analysis detailing your home's value as well as a comparison with similar homes in the area
Home Values in the Area
Average Home Value in this Area
Purchase History
| Date | Buyer | Sale Price | Title Company |
|---|---|---|---|
| Patel Nayan K | -- | Prabhu Nikhil R | |
| Patel Nayan K | $169,900 | -- | |
| Hayes Royce | $135,000 | -- | |
| Galvin Hannah Mae | -- | -- |
Source: Public Records
Mortgage History
| Date | Status | Borrower | Loan Amount |
|---|---|---|---|
| Previous Owner | Patel Nayan K | $161,405 | |
| Previous Owner | Hayes Royce L | $127,950 | |
| Previous Owner | Hayes Royce | $124,000 | |
| Previous Owner | Galvin Hannan M | $50,000 | |
| Previous Owner | Galvin Hannah Mae | $50,000 |
Source: Public Records
Tax History Compared to Growth
Tax History
| Year | Tax Paid | Tax Assessment Tax Assessment Total Assessment is a certain percentage of the fair market value that is determined by local assessors to be the total taxable value of land and additions on the property. | Land | Improvement |
|---|---|---|---|---|
| 2024 | $3,388 | $138,168 | $60,000 | $78,168 |
| 2023 | $3,232 | $131,304 | $60,000 | $71,304 |
| 2022 | $3,006 | $88,012 | $32,000 | $56,012 |
| 2021 | $2,430 | $88,012 | $32,000 | $56,012 |
| 2020 | $2,296 | $83,148 | $24,000 | $59,148 |
| 2019 | $2,137 | $77,284 | $24,000 | $53,284 |
| 2018 | $1,796 | $64,940 | $24,000 | $40,940 |
| 2017 | $1,837 | $66,176 | $24,000 | $42,176 |
| 2016 | $1,621 | $58,416 | $20,000 | $38,416 |
| 2015 | $1,513 | $54,416 | $16,000 | $38,416 |
| 2014 | $1,404 | $53,036 | $0 | $0 |
Source: Public Records
Map
Nearby Homes
- 215 Fernbank St
- 845 Vintner Ct
- 255 White Pines Dr
- 2920 Ridge Spring Ct
- 3325 Woodside Cir
- 1040 Poppy Pointe
- 13943 Sunfish Bend
- 3380 Galleon Dr
- 1610 Trellis Crossing
- 925 Hargrove Point Way
- 14143 Yacht Terrace
- 860 Hargrove Point Way
- 14187 Yacht Terrace
- 3329 Seaward View
- 1725 Lynwood Place
- 1625 Overland Crossing
- 1145 Ledmark Ct
- 100 Huntington Cir Unit 3
- 110 Huntington Cir
- 425 Huntington Dr
- 536 Tidwell Rd Unit 3
- 435 Huntington Dr Unit 2
- 415 Huntington Dr
- 544 Tidwell Rd Unit 3
- 120 Huntington Cir
- 105 Huntington Cir
- 520 Tidwell Rd
- 445 Huntington Dr
- 552 Tidwell Rd Unit 3
- 115 Huntington Cir
- 130 Huntington Cir
- 455 Huntington Dr
- 420 Huntington Dr
- 430 Huntington Dr
- 212 Fernbank St
- 125 Huntington Cir Unit 3
- 210 Fernbank St