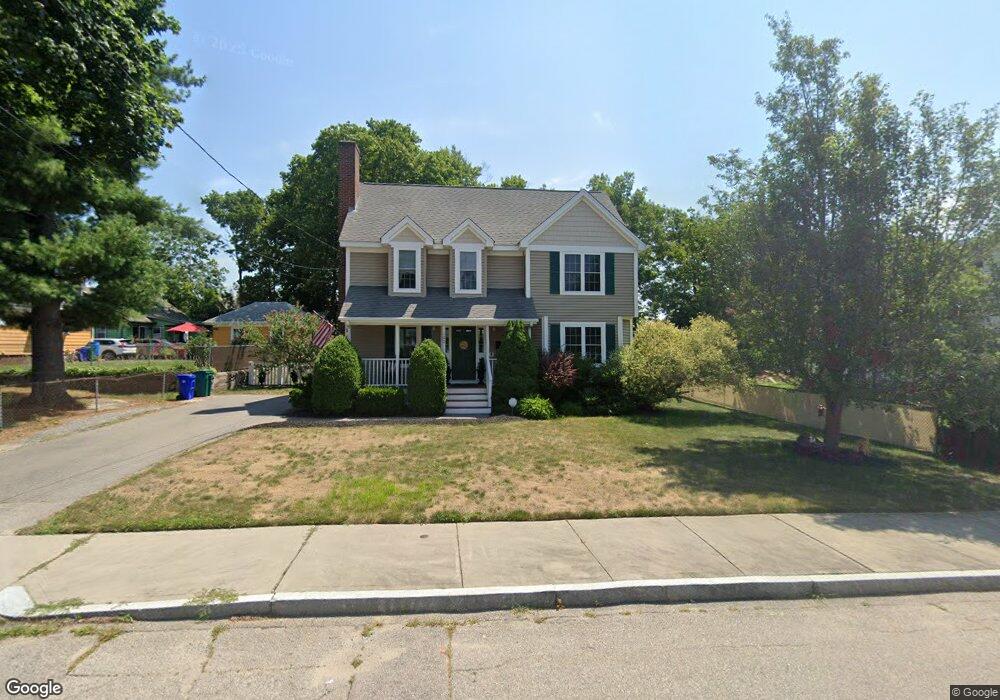
100 James St Attleboro, MA 02703
Estimated Value: $565,000 - $648,000
3
Beds
2
Baths
1,808
Sq Ft
$326/Sq Ft
Est. Value
About This Home
This home is located at 100 James St, Attleboro, MA 02703 and is currently estimated at $589,117, approximately $325 per square foot. 100 James St is a home located in Bristol County with nearby schools including Peter Thacher Elementary School, Wamsutta Middle School, and Attleboro High School.
Ownership History
Date
Name
Owned For
Owner Type
Purchase Details
Closed on
Oct 27, 2011
Sold by
Sigman Myles D and Sigman Nicole M
Bought by
Saintilien Mario
Current Estimated Value
Home Financials for this Owner
Home Financials are based on the most recent Mortgage that was taken out on this home.
Original Mortgage
$292,648
Outstanding Balance
$200,423
Interest Rate
4.11%
Mortgage Type
Purchase Money Mortgage
Estimated Equity
$388,694
Purchase Details
Closed on
Dec 17, 2004
Sold by
Caponigro Timothy J and Proulx Ronald J
Bought by
Sigman Myles D and Waseleski Nicole M
Home Financials for this Owner
Home Financials are based on the most recent Mortgage that was taken out on this home.
Original Mortgage
$245,520
Interest Rate
5.68%
Mortgage Type
Purchase Money Mortgage
Create a Home Valuation Report for This Property
The Home Valuation Report is an in-depth analysis detailing your home's value as well as a comparison with similar homes in the area
Home Values in the Area
Average Home Value in this Area
Purchase History
| Date | Buyer | Sale Price | Title Company |
|---|---|---|---|
| Saintilien Mario | $290,000 | -- | |
| Sigman Myles D | $306,900 | -- |
Source: Public Records
Mortgage History
| Date | Status | Borrower | Loan Amount |
|---|---|---|---|
| Open | Saintilien Mario | $292,648 | |
| Previous Owner | Sigman Myles D | $245,520 |
Source: Public Records
Tax History
| Year | Tax Paid | Tax Assessment Tax Assessment Total Assessment is a certain percentage of the fair market value that is determined by local assessors to be the total taxable value of land and additions on the property. | Land | Improvement |
|---|---|---|---|---|
| 2025 | $6,257 | $498,600 | $125,800 | $372,800 |
| 2024 | $6,081 | $477,700 | $125,800 | $351,900 |
| 2023 | $5,499 | $401,700 | $114,300 | $287,400 |
| 2022 | $5,241 | $362,700 | $108,900 | $253,800 |
| 2021 | $5,221 | $352,800 | $104,800 | $248,000 |
| 2020 | $5,003 | $343,600 | $101,600 | $242,000 |
| 2019 | $4,878 | $344,500 | $99,700 | $244,800 |
| 2018 | $4,698 | $317,000 | $96,800 | $220,200 |
| 2017 | $4,615 | $317,200 | $96,800 | $220,400 |
| 2016 | $4,470 | $301,600 | $90,400 | $211,200 |
| 2015 | $4,334 | $294,600 | $90,400 | $204,200 |
| 2014 | $4,265 | $287,200 | $85,700 | $201,500 |
Source: Public Records
Map
Nearby Homes
- 95 Mulberry St
- 36 Hazel St
- 91 East St
- 61 Pine St Unit 9
- 70 Riverside Ave
- 28 Pine St Unit C
- 3 Robert St
- 17 Davis Ave
- 147 County St
- 37 Holman St
- 45 Holman St
- 567 Park St
- 32 Park St Unit 4
- 0 Rosedale Ln Unit 73469293
- 21 4th St
- 49 Dennis St
- 72 Grant St
- 64 Mechanic St Unit 3
- 64 Mechanic St
- 75 Dennis St Unit 3
Your Personal Tour Guide
Ask me questions while you tour the home.