Estimated Value: $223,000 - $258,000
4
Beds
3
Baths
2,166
Sq Ft
$111/Sq Ft
Est. Value
About This Home
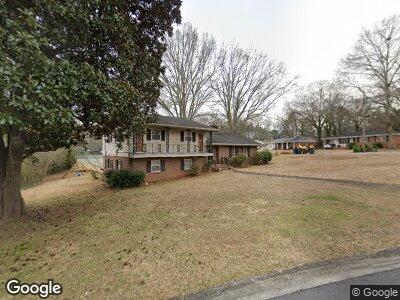
This home is located at 100 Jim Lee Dr NE Unit NE, Rome, GA 30161 and is currently estimated at $239,862, approximately $110 per square foot. 100 Jim Lee Dr NE Unit NE is a home located in Floyd County with nearby schools including Rome High School, Unity Christian School, and Unity Christian School.
Ownership History
Date
Name
Owned For
Owner Type
Purchase Details
Closed on
Dec 29, 2021
Sold by
Davidson Stephanie S
Bought by
Rose David Trenton and Rose Star Lynn
Current Estimated Value
Home Financials for this Owner
Home Financials are based on the most recent Mortgage that was taken out on this home.
Original Mortgage
$185,576
Interest Rate
3.05%
Mortgage Type
FHA
Purchase Details
Closed on
Sep 25, 2007
Sold by
Not Provided
Bought by
Davidson Henry R and Stephanie Davidson
Purchase Details
Closed on
Aug 28, 2000
Sold by
Duncan Gail and Funderburk Sandra D
Bought by
Mcdaniel Stephanie S
Purchase Details
Closed on
Oct 8, 1999
Sold by
Duncan Katherine C
Bought by
Duncan Gail and Funderburk Sandra D
Purchase Details
Closed on
Aug 15, 1983
Sold by
Duncan Damon P and Duncan Katherine C
Bought by
Duncan Katherine C
Purchase Details
Closed on
Jan 1, 1901
Bought by
Duncan Damon P and Duncan Katherine C
Create a Home Valuation Report for This Property
The Home Valuation Report is an in-depth analysis detailing your home's value as well as a comparison with similar homes in the area
Home Values in the Area
Average Home Value in this Area
Purchase History
| Date | Buyer | Sale Price | Title Company |
|---|---|---|---|
| Rose David Trenton | $189,000 | -- | |
| Davidson Henry R | -- | -- | |
| Mcdaniel Stephanie S | $97,900 | -- | |
| Duncan Gail | -- | -- | |
| Duncan Katherine C | -- | -- | |
| Duncan Damon P | -- | -- |
Source: Public Records
Mortgage History
| Date | Status | Borrower | Loan Amount |
|---|---|---|---|
| Open | Rose David Trenton | $185,576 | |
| Closed | Rose David Trenton | $185,576 | |
| Closed | Rose David Trenton | $185,576 | |
| Closed | Rose David Trenton | $6,615 |
Source: Public Records
Tax History Compared to Growth
Tax History
| Year | Tax Paid | Tax Assessment Tax Assessment Total Assessment is a certain percentage of the fair market value that is determined by local assessors to be the total taxable value of land and additions on the property. | Land | Improvement |
|---|---|---|---|---|
| 2024 | $2,665 | $75,257 | $7,351 | $67,906 |
| 2023 | $2,665 | $71,434 | $6,486 | $64,948 |
| 2022 | $2,437 | $66,773 | $5,189 | $61,584 |
| 2021 | $2,081 | $56,092 | $5,189 | $50,903 |
| 2020 | $1,930 | $51,571 | $3,892 | $47,679 |
| 2019 | $1,790 | $48,346 | $3,892 | $44,454 |
| 2018 | $1,670 | $45,122 | $3,892 | $41,230 |
| 2017 | $1,264 | $34,153 | $3,892 | $30,261 |
| 2016 | $1,233 | $33,200 | $3,880 | $29,320 |
| 2015 | $1,200 | $34,218 | $3,880 | $30,338 |
| 2014 | $1,200 | $34,218 | $3,880 | $30,338 |
Source: Public Records
Map
Nearby Homes
- 112 E Valley Rd NE
- 127 Jim Lee Dr NE
- 3 Hillcrest Ave NE
- 113 Northwood Dr NE
- 33 Berkshire Dr NE
- 10 Forest Ln NE
- 507 Superba Ave NE
- 7 Berkshire Ln NE
- 4 Highland St NE
- 206 Church St NE
- 209 Church St NE
- 0 Georgia 293
- 413 Stonewall St NE
- 0 Wilshire Rd NE Unit 7485224
- 0 Wilshire Rd NE Unit 10396957
- 313 Kingston Ave NE
- 142 Wilshire Rd NE
- 307 Kingston Ave NE
- 312 Perkins St NE
- 100 Jim Lee Dr NE
- 0 Jim Lee Dr Drne Dr
- 100 Jim Lee Dr Drne Dr
- 100 Jim Lee Dr NE Unit NE
- 109 Penncrest Dr NE
- 102 Jim Lee Dr NE
- 108 Penncrest Dr NE
- 101 Jim Lee Dr NE
- 106 Penncrest Dr NE
- 111 Penncrest Dr NE
- 107 Atteiram Dr NE
- 110 Penncrest Dr NE
- 104 Jim Lee Dr NE
- 104 Penncrest Dr NE
- 103 Jim Lee Dr NE
- 102 Penncrest Dr NE
- 109 Atteiram Dr NE
- 112 Penncrest Dr NE
- 111 Atteiram Dr NE
- 103 Penncrest Dr NE